Nepalese vs Immigrants from Czechoslovakia 5th Grade

COMPARE

Nepalese
Race
Ancestry
AfghanAfricanAlaska NativeAlaskan AthabascanAlbanianAleutAlsatianAmericanApacheArabArapahoArgentineanArmenianAssyrian/Chaldean/SyriacAustralianAustrianBahamianBangladeshiBarbadianBasqueBelgianBelizeanBermudanBhutaneseBlackfeetBolivianBrazilianBritishBritish West IndianBulgarianBurmeseCajunCambodianCanadianCape VerdeanCarpatho RusynCelticCentral AmericanCentral American IndianCherokeeCheyenneChickasawChileanChineseChippewaChoctawColombianColvilleComancheCosta RicanCreeCreekCroatianCrowCubanCypriotCzechCzechoslovakianDanishDelawareDominicanDutchDutch West IndianEastern EuropeanEcuadorianEgyptianEnglishEstonianEthiopianEuropeanFijianFilipinoFinnishFrenchFrench American IndianFrench CanadianGermanGerman RussianGhanaianGreekGuamanian/ChamorroGuatemalanGuyaneseHaitianHmongHonduranHopiHoumaHungarianIcelanderIndian (Asian)IndonesianInupiatIranianIraqiIrishIroquoisIsraeliItalianJamaicanJapaneseJordanianKenyanKiowaKoreanLaotianLatvianLebaneseLiberianLithuanianLumbeeLuxembourgerMacedonianMalaysianMalteseMarshalleseMenomineeMexicanMexican American IndianMongolianMoroccanNative HawaiianNavajoNepaleseNew ZealanderNicaraguanNigerianNorthern EuropeanNorwegianOkinawanOsageOttawaPaiutePakistaniPalestinianPanamanianParaguayanPennsylvania GermanPeruvianPimaPolishPortuguesePotawatomiPuebloPuerto RicanPuget Sound SalishRomanianRussianSalvadoranSamoanScandinavianScotch-IrishScottishSeminoleSenegaleseSerbianShoshoneSierra LeoneanSiouxSlavicSlovakSloveneSomaliSouth AfricanSouth AmericanSouth American IndianSoviet UnionSpaniardSpanishSpanish AmericanSpanish American IndianSri LankanSubsaharan AfricanSudaneseSwedishSwissSyrianTaiwaneseThaiTlingit-HaidaTohono O'OdhamTonganTrinidadian and TobagonianTsimshianTurkishU.S. Virgin IslanderUgandanUkrainianUruguayanUteVenezuelanVietnameseWelshWest IndianYakamaYaquiYugoslavianYumanYup'ikZimbabwean
Immigration
NonimmigrantsImmigrantsAfghanistanAfricaAlbaniaArgentinaArmeniaAsiaAustraliaAustriaBahamasBangladeshBarbadosBelarusBelgiumBelizeBoliviaBosnia and HerzegovinaBrazilBulgariaBurma/MyanmarCabo VerdeCambodiaCameroonCanadaCaribbeanCentral AmericaChileChinaColombiaCongoCosta RicaCroatiaCubaDenmarkDominicaDominican RepublicEastern AfricaEastern AsiaEastern EuropeEcuadorEgyptEl SalvadorEnglandEritreaEthiopiaEuropeFijiFranceGermanyGhanaGreeceGrenadaGuatemalaGuyanaHaitiHondurasHong KongHungaryIndiaIndonesiaIranIraqIrelandIsraelItalyJamaicaJapanJordanKazakhstanKenyaKoreaKuwaitLaosLatin AmericaLatviaLebanonLiberiaLithuaniaMalaysiaMexicoMicronesiaMiddle AfricaMoldovaMoroccoNepalNetherlandsNicaraguaNigeriaNorth AmericaNorth MacedoniaNorthern AfricaNorthern EuropeNorwayOceaniaPakistanPanamaPeruPhilippinesPolandPortugalRomaniaRussiaSaudi ArabiaScotlandSenegalSerbiaSierra LeoneSingaporeSomaliaSouth AfricaSouth AmericaSouth Central AsiaSouth Eastern AsiaSouthern EuropeSpainSri LankaSt. Vincent and the GrenadinesSudanSwedenSwitzerlandSyriaTaiwanThailandTrinidad and TobagoTurkeyUgandaUkraineUruguayUzbekistanVenezuelaVietnamWest IndiesWestern AfricaWestern AsiaWestern EuropeYemenZaireZimbabweAzores
Immigrants from Czechoslovakia
Race
Ancestry
AfghanAfricanAlaska NativeAlaskan AthabascanAlbanianAleutAlsatianAmericanApacheArabArapahoArgentineanArmenianAssyrian/Chaldean/SyriacAustralianAustrianBahamianBangladeshiBarbadianBasqueBelgianBelizeanBermudanBhutaneseBlackfeetBolivianBrazilianBritishBritish West IndianBulgarianBurmeseCajunCambodianCanadianCape VerdeanCarpatho RusynCelticCentral AmericanCentral American IndianCherokeeCheyenneChickasawChileanChineseChippewaChoctawColombianColvilleComancheCosta RicanCreeCreekCroatianCrowCubanCypriotCzechCzechoslovakianDanishDelawareDominicanDutchDutch West IndianEastern EuropeanEcuadorianEgyptianEnglishEstonianEthiopianEuropeanFijianFilipinoFinnishFrenchFrench American IndianFrench CanadianGermanGerman RussianGhanaianGreekGuamanian/ChamorroGuatemalanGuyaneseHaitianHmongHonduranHopiHoumaHungarianIcelanderIndian (Asian)IndonesianInupiatIranianIraqiIrishIroquoisIsraeliItalianJamaicanJapaneseJordanianKenyanKiowaKoreanLaotianLatvianLebaneseLiberianLithuanianLumbeeLuxembourgerMacedonianMalaysianMalteseMarshalleseMenomineeMexicanMexican American IndianMongolianMoroccanNative HawaiianNavajoNew ZealanderNicaraguanNigerianNorthern EuropeanNorwegianOkinawanOsageOttawaPaiutePakistaniPalestinianPanamanianParaguayanPennsylvania GermanPeruvianPimaPolishPortuguesePotawatomiPuebloPuerto RicanPuget Sound SalishRomanianRussianSalvadoranSamoanScandinavianScotch-IrishScottishSeminoleSenegaleseSerbianShoshoneSierra LeoneanSiouxSlavicSlovakSloveneSomaliSouth AfricanSouth AmericanSouth American IndianSoviet UnionSpaniardSpanishSpanish AmericanSpanish American IndianSri LankanSubsaharan AfricanSudaneseSwedishSwissSyrianTaiwaneseThaiTlingit-HaidaTohono O'OdhamTonganTrinidadian and TobagonianTsimshianTurkishU.S. Virgin IslanderUgandanUkrainianUruguayanUteVenezuelanVietnameseWelshWest IndianYakamaYaquiYugoslavianYumanYup'ikZimbabwean
Immigration
NonimmigrantsImmigrantsAfghanistanAfricaAlbaniaArgentinaArmeniaAsiaAustraliaAustriaBahamasBangladeshBarbadosBelarusBelgiumBelizeBoliviaBosnia and HerzegovinaBrazilBulgariaBurma/MyanmarCabo VerdeCambodiaCameroonCanadaCaribbeanCentral AmericaChileChinaColombiaCongoCosta RicaCroatiaCubaCzechoslovakiaDenmarkDominicaDominican RepublicEastern AfricaEastern AsiaEastern EuropeEcuadorEgyptEl SalvadorEnglandEritreaEthiopiaEuropeFijiFranceGermanyGhanaGreeceGrenadaGuatemalaGuyanaHaitiHondurasHong KongHungaryIndiaIndonesiaIranIraqIrelandIsraelItalyJamaicaJapanJordanKazakhstanKenyaKoreaKuwaitLaosLatin AmericaLatviaLebanonLiberiaLithuaniaMalaysiaMexicoMicronesiaMiddle AfricaMoldovaMoroccoNepalNetherlandsNicaraguaNigeriaNorth AmericaNorth MacedoniaNorthern AfricaNorthern EuropeNorwayOceaniaPakistanPanamaPeruPhilippinesPolandPortugalRomaniaRussiaSaudi ArabiaScotlandSenegalSerbiaSierra LeoneSingaporeSomaliaSouth AfricaSouth AmericaSouth Central AsiaSouth Eastern AsiaSouthern EuropeSpainSri LankaSt. Vincent and the GrenadinesSudanSwedenSwitzerlandSyriaTaiwanThailandTrinidad and TobagoTurkeyUgandaUkraineUruguayUzbekistanVenezuelaVietnamWest IndiesWestern AfricaWestern AsiaWestern EuropeYemenZaireZimbabweAzores
5th Grade
Income
Poverty
Unemployment
Labor Participation
Family Structure
Vehicle Availability
Education Level
Disability

5th Grade Comparison

Nepalese

Immigrants from Czechoslovakia

Tragic
Exceptional
95.2%
5TH GRADE
0.0/ 100
METRIC RATING
334th/ 347
METRIC RANK
97.7%
5TH GRADE
97.5/ 100
METRIC RATING
106th/ 347
METRIC RANK

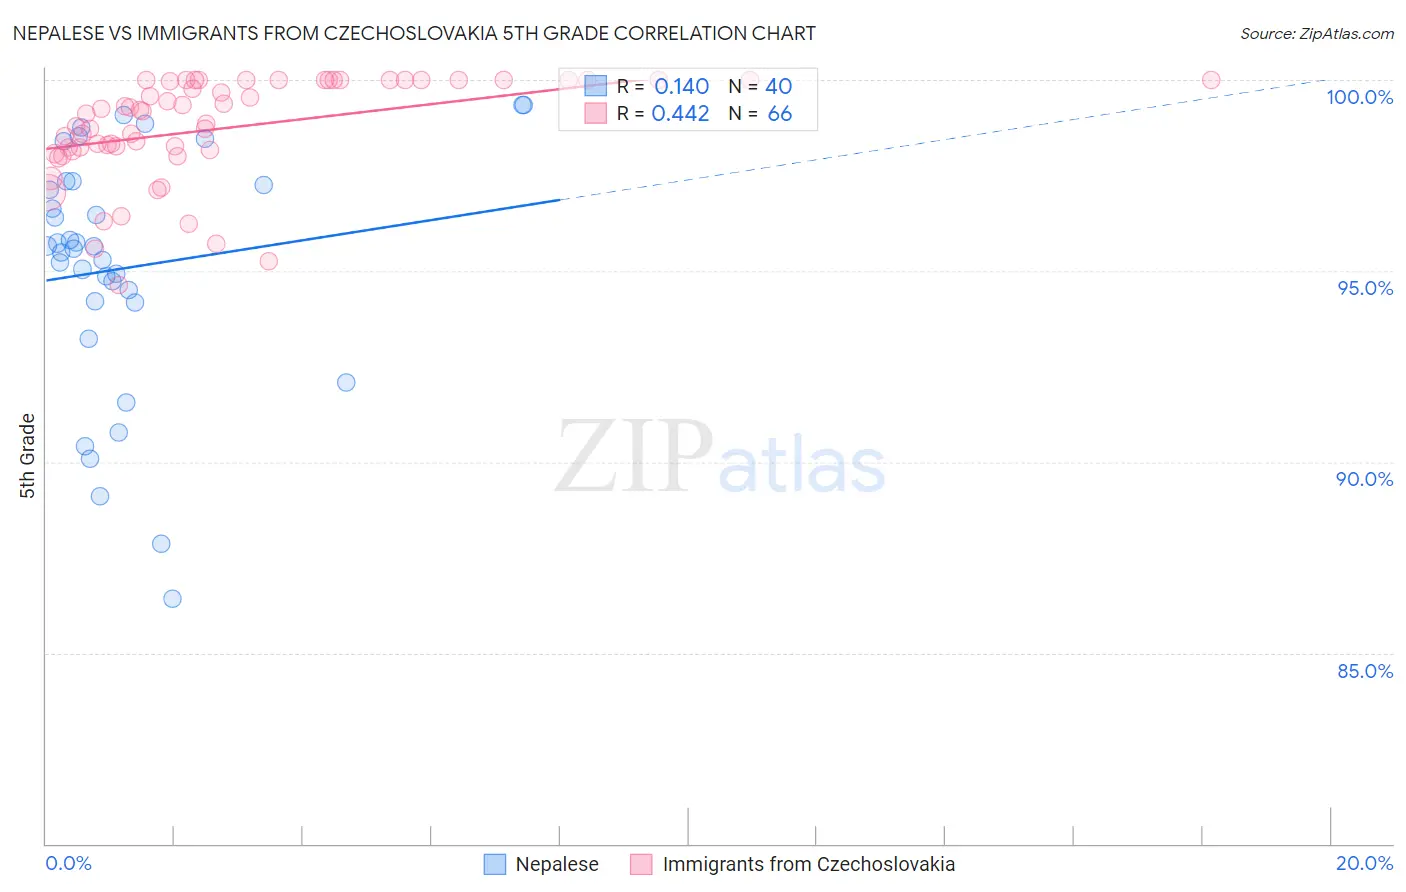
Nepalese vs Immigrants from Czechoslovakia 5th Grade Correlation Chart

The statistical analysis conducted on geographies consisting of 24,521,755 people shows a poor positive correlation between the proportion of Nepalese and percentage of population with at least 5th grade education in the United States with a correlation coefficient (R) of 0.140 and weighted average of 95.2%. Similarly, the statistical analysis conducted on geographies consisting of 195,448,060 people shows a moderate positive correlation between the proportion of Immigrants from Czechoslovakia and percentage of population with at least 5th grade education in the United States with a correlation coefficient (R) of 0.442 and weighted average of 97.7%, a difference of 2.6%.
Nepalese vs Immigrants from Czechoslovakia 5th Grade

5th Grade Correlation Summary

MeasurementNepaleseImmigrants from Czechoslovakia
Minimum86.4%94.6%
Maximum99.3%100.0%
Range12.9%5.4%
Mean95.1%98.7%
Median95.6%99.1%
Interquartile 25% (IQ1)94.2%98.2%
Interquartile 75% (IQ3)97.3%100.0%
Interquartile Range (IQR)3.1%1.8%
Standard Deviation (Sample)3.2%1.4%
Standard Deviation (Population)3.2%1.3%

Similar Demographics by 5th Grade

Demographics Similar to Nepalese by 5th Grade

In terms of 5th grade, the demographic groups most similar to Nepalese are Immigrants from Dominican Republic (95.3%, a difference of 0.030%), Immigrants from Latin America (95.3%, a difference of 0.030%), Mexican (95.2%, a difference of 0.030%), Immigrants from the Azores (95.1%, a difference of 0.13%), and Immigrants from Honduras (95.4%, a difference of 0.14%).
DemographicsRating | Rank5th Grade
Dominicans
0.0
/100
|
#327
Tragic
95.5%
Cape Verdeans
0.0
/100
|
#328
Tragic
95.5%
Mexican American Indians
0.0
/100
|
#329
Tragic
95.5%
Immigrants | Armenia
0.0
/100
|
#330
Tragic
95.4%
Immigrants | Honduras
0.0
/100
|
#331
Tragic
95.4%
Immigrants | Dominican Republic
0.0
/100
|
#332
Tragic
95.3%
Immigrants | Latin America
0.0
/100
|
#333
Tragic
95.3%
Nepalese
0.0
/100
|
#334
Tragic
95.2%
Mexicans
0.0
/100
|
#335
Tragic
95.2%
Immigrants | Azores
0.0
/100
|
#336
Tragic
95.1%
Central Americans
0.0
/100
|
#337
Tragic
95.1%
Immigrants | Cabo Verde
0.0
/100
|
#338
Tragic
94.9%
Immigrants | Yemen
0.0
/100
|
#339
Tragic
94.9%
Guatemalans
0.0
/100
|
#340
Tragic
94.8%
Yakama
0.0
/100
|
#341
Tragic
94.8%

Demographics Similar to Immigrants from Czechoslovakia by 5th Grade

In terms of 5th grade, the demographic groups most similar to Immigrants from Czechoslovakia are Bhutanese (97.7%, a difference of 0.0%), Immigrants from Singapore (97.7%, a difference of 0.0%), German Russian (97.7%, a difference of 0.010%), Nonimmigrants (97.7%, a difference of 0.010%), and Choctaw (97.7%, a difference of 0.020%).
DemographicsRating | Rank5th Grade
Turks
98.3
/100
|
#99
Exceptional
97.7%
Puget Sound Salish
98.3
/100
|
#100
Exceptional
97.7%
South Africans
98.3
/100
|
#101
Exceptional
97.7%
Choctaw
98.0
/100
|
#102
Exceptional
97.7%
Cheyenne
97.9
/100
|
#103
Exceptional
97.7%
German Russians
97.8
/100
|
#104
Exceptional
97.7%
Bhutanese
97.6
/100
|
#105
Exceptional
97.7%
Immigrants | Czechoslovakia
97.5
/100
|
#106
Exceptional
97.7%
Immigrants | Singapore
97.5
/100
|
#107
Exceptional
97.7%
Immigrants | Nonimmigrants
97.3
/100
|
#108
Exceptional
97.7%
Immigrants | Latvia
97.1
/100
|
#109
Exceptional
97.7%
Thais
96.9
/100
|
#110
Exceptional
97.7%
Menominee
96.3
/100
|
#111
Exceptional
97.7%
Immigrants | Switzerland
96.0
/100
|
#112
Exceptional
97.7%
Iroquois
95.9
/100
|
#113
Exceptional
97.7%