Nepalese vs Apache Single Father Poverty
COMPARE
Nepalese
Apache
Single Father Poverty
Single Father Poverty Comparison
Nepalese
Apache
14.4%
SINGLE FATHER POVERTY
100.0/ 100
METRIC RATING
27th/ 347
METRIC RANK
24.2%
SINGLE FATHER POVERTY
0.0/ 100
METRIC RATING
339th/ 347
METRIC RANK
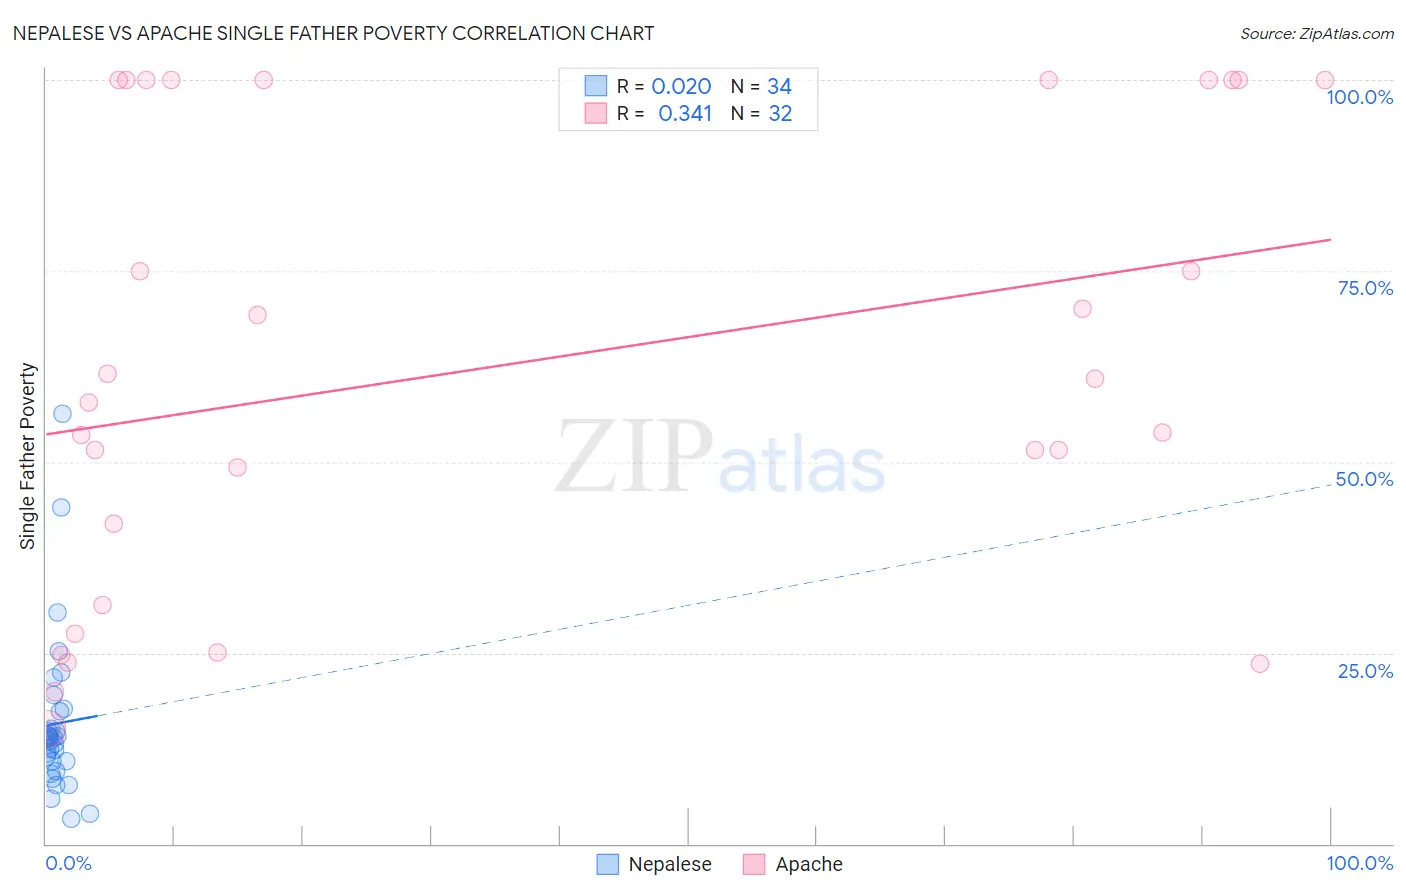
Nepalese vs Apache Single Father Poverty Correlation Chart
The statistical analysis conducted on geographies consisting of 23,366,556 people shows no correlation between the proportion of Nepalese and poverty level among single fathers in the United States with a correlation coefficient (R) of 0.020 and weighted average of 14.4%. Similarly, the statistical analysis conducted on geographies consisting of 199,792,986 people shows a mild positive correlation between the proportion of Apache and poverty level among single fathers in the United States with a correlation coefficient (R) of 0.341 and weighted average of 24.2%, a difference of 68.0%.
Single Father Poverty Correlation Summary
| Measurement | Nepalese | Apache |
| Minimum | 3.3% | 15.1% |
| Maximum | 56.2% | 100.0% |
| Range | 52.9% | 84.9% |
| Mean | 15.7% | 62.9% |
| Median | 13.8% | 59.3% |
| Interquartile 25% (IQ1) | 10.8% | 36.6% |
| Interquartile 75% (IQ3) | 17.3% | 100.0% |
| Interquartile Range (IQR) | 6.5% | 63.4% |
| Standard Deviation (Sample) | 10.5% | 29.9% |
| Standard Deviation (Population) | 10.3% | 29.4% |
Similar Demographics by Single Father Poverty
Demographics Similar to Nepalese by Single Father Poverty
In terms of single father poverty, the demographic groups most similar to Nepalese are Spanish American Indian (14.4%, a difference of 0.050%), Iranian (14.4%, a difference of 0.48%), Immigrants from South Eastern Asia (14.4%, a difference of 0.51%), Immigrants from Egypt (14.4%, a difference of 0.52%), and Immigrants from South Central Asia (14.5%, a difference of 0.53%).
| Demographics | Rating | Rank | Single Father Poverty |
| Immigrants | Singapore | 100.0 /100 | #20 | Exceptional 14.3% |
| Immigrants | Afghanistan | 100.0 /100 | #21 | Exceptional 14.3% |
| Taiwanese | 100.0 /100 | #22 | Exceptional 14.3% |
| Immigrants | Egypt | 100.0 /100 | #23 | Exceptional 14.4% |
| Immigrants | South Eastern Asia | 100.0 /100 | #24 | Exceptional 14.4% |
| Iranians | 100.0 /100 | #25 | Exceptional 14.4% |
| Spanish American Indians | 100.0 /100 | #26 | Exceptional 14.4% |
| Nepalese | 100.0 /100 | #27 | Exceptional 14.4% |
| Immigrants | South Central Asia | 100.0 /100 | #28 | Exceptional 14.5% |
| Somalis | 100.0 /100 | #29 | Exceptional 14.5% |
| Thais | 100.0 /100 | #30 | Exceptional 14.5% |
| Icelanders | 100.0 /100 | #31 | Exceptional 14.5% |
| Asians | 100.0 /100 | #32 | Exceptional 14.6% |
| Okinawans | 100.0 /100 | #33 | Exceptional 14.6% |
| Egyptians | 100.0 /100 | #34 | Exceptional 14.7% |
Demographics Similar to Apache by Single Father Poverty
In terms of single father poverty, the demographic groups most similar to Apache are Arapaho (24.0%, a difference of 1.1%), Sioux (23.9%, a difference of 1.5%), Cajun (23.1%, a difference of 5.1%), Shoshone (22.9%, a difference of 5.8%), and Kiowa (22.5%, a difference of 7.9%).
| Demographics | Rating | Rank | Single Father Poverty |
| Tohono O'odham | 0.0 /100 | #332 | Tragic 22.0% |
| Natives/Alaskans | 0.0 /100 | #333 | Tragic 22.4% |
| Kiowa | 0.0 /100 | #334 | Tragic 22.5% |
| Shoshone | 0.0 /100 | #335 | Tragic 22.9% |
| Cajuns | 0.0 /100 | #336 | Tragic 23.1% |
| Sioux | 0.0 /100 | #337 | Tragic 23.9% |
| Arapaho | 0.0 /100 | #338 | Tragic 24.0% |
| Apache | 0.0 /100 | #339 | Tragic 24.2% |
| Houma | 0.0 /100 | #340 | Tragic 26.7% |
| Hopi | 0.0 /100 | #341 | Tragic 27.2% |
| Yuman | 0.0 /100 | #342 | Tragic 28.4% |
| Lumbee | 0.0 /100 | #343 | Tragic 28.5% |
| Navajo | 0.0 /100 | #344 | Tragic 29.2% |
| Crow | 0.0 /100 | #345 | Tragic 30.3% |
| Puerto Ricans | 0.0 /100 | #346 | Tragic 31.5% |