Nepalese vs Sierra Leonean Female Poverty
COMPARE
Nepalese
Sierra Leonean
Female Poverty
Female Poverty Comparison
Nepalese
Sierra Leoneans
15.2%
FEMALE POVERTY
0.4/ 100
METRIC RATING
242nd/ 347
METRIC RANK
13.7%
FEMALE POVERTY
33.1/ 100
METRIC RATING
190th/ 347
METRIC RANK
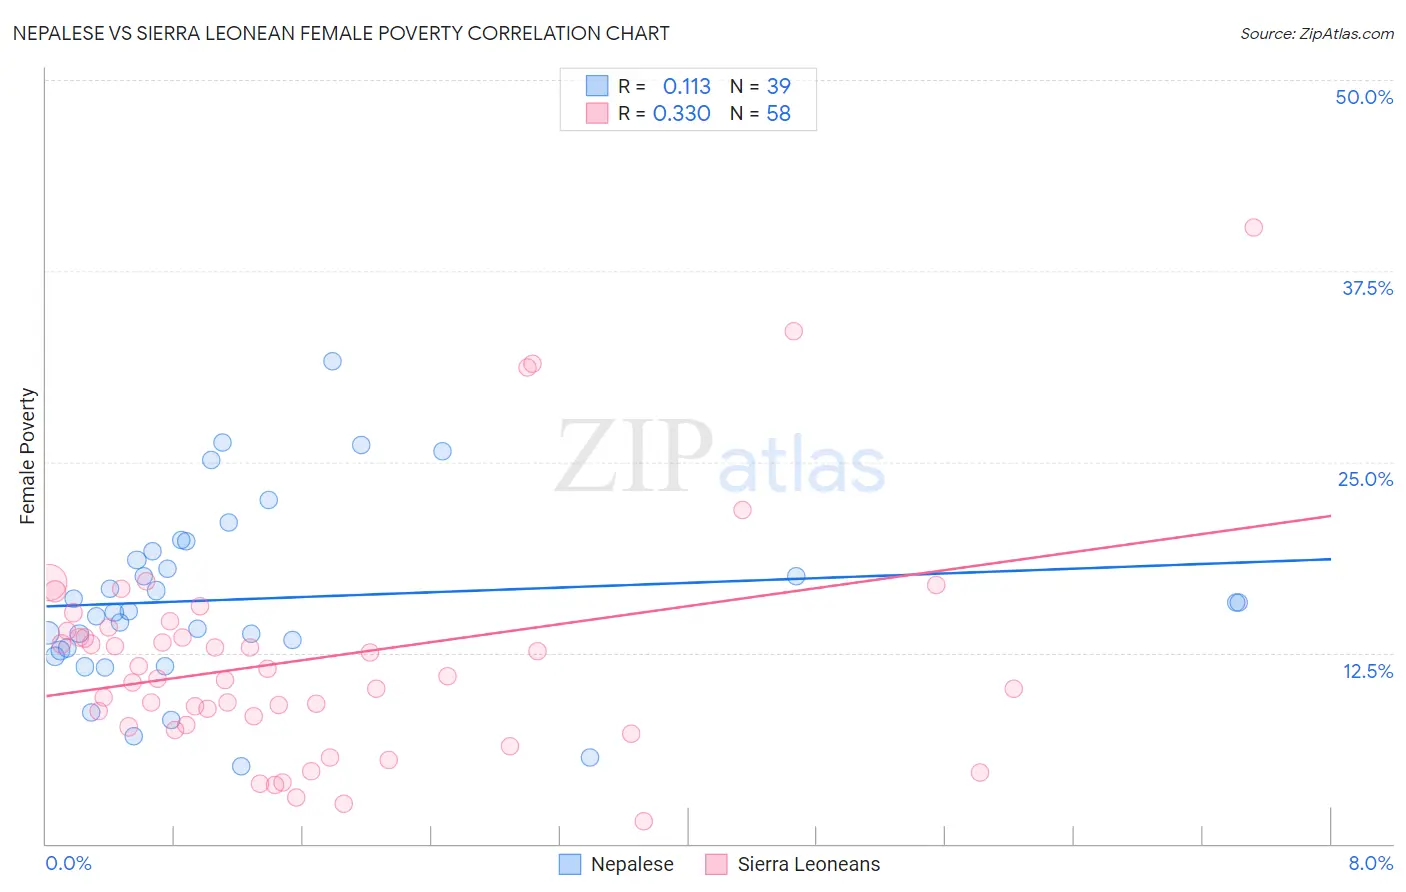
Nepalese vs Sierra Leonean Female Poverty Correlation Chart
The statistical analysis conducted on geographies consisting of 24,519,269 people shows a poor positive correlation between the proportion of Nepalese and poverty level among females in the United States with a correlation coefficient (R) of 0.113 and weighted average of 15.2%. Similarly, the statistical analysis conducted on geographies consisting of 83,350,076 people shows a mild positive correlation between the proportion of Sierra Leoneans and poverty level among females in the United States with a correlation coefficient (R) of 0.330 and weighted average of 13.7%, a difference of 11.5%.
Female Poverty Correlation Summary
| Measurement | Nepalese | Sierra Leonean |
| Minimum | 5.1% | 1.5% |
| Maximum | 31.6% | 40.4% |
| Range | 26.5% | 38.9% |
| Mean | 16.0% | 12.1% |
| Median | 15.3% | 10.9% |
| Interquartile 25% (IQ1) | 12.6% | 7.8% |
| Interquartile 75% (IQ3) | 19.2% | 13.9% |
| Interquartile Range (IQR) | 6.5% | 6.1% |
| Standard Deviation (Sample) | 5.8% | 7.4% |
| Standard Deviation (Population) | 5.8% | 7.4% |
Similar Demographics by Female Poverty
Demographics Similar to Nepalese by Female Poverty
In terms of female poverty, the demographic groups most similar to Nepalese are Immigrants from Sudan (15.2%, a difference of 0.12%), Nicaraguan (15.3%, a difference of 0.24%), Ecuadorian (15.3%, a difference of 0.29%), Sudanese (15.2%, a difference of 0.37%), and Spanish American Indian (15.3%, a difference of 0.39%).
| Demographics | Rating | Rank | Female Poverty |
| Immigrants | Laos | 0.9 /100 | #235 | Tragic 15.0% |
| Cree | 0.7 /100 | #236 | Tragic 15.1% |
| French American Indians | 0.6 /100 | #237 | Tragic 15.1% |
| Immigrants | Armenia | 0.6 /100 | #238 | Tragic 15.1% |
| Immigrants | Middle Africa | 0.5 /100 | #239 | Tragic 15.2% |
| Sudanese | 0.5 /100 | #240 | Tragic 15.2% |
| Immigrants | Sudan | 0.4 /100 | #241 | Tragic 15.2% |
| Nepalese | 0.4 /100 | #242 | Tragic 15.2% |
| Nicaraguans | 0.3 /100 | #243 | Tragic 15.3% |
| Ecuadorians | 0.3 /100 | #244 | Tragic 15.3% |
| Spanish American Indians | 0.3 /100 | #245 | Tragic 15.3% |
| Cubans | 0.3 /100 | #246 | Tragic 15.3% |
| Potawatomi | 0.3 /100 | #247 | Tragic 15.3% |
| Immigrants | Ghana | 0.3 /100 | #248 | Tragic 15.3% |
| Salvadorans | 0.3 /100 | #249 | Tragic 15.3% |
Demographics Similar to Sierra Leoneans by Female Poverty
In terms of female poverty, the demographic groups most similar to Sierra Leoneans are Immigrants from Kuwait (13.7%, a difference of 0.040%), Immigrants from Costa Rica (13.7%, a difference of 0.13%), Iraqi (13.7%, a difference of 0.14%), Delaware (13.7%, a difference of 0.21%), and Immigrants from South America (13.7%, a difference of 0.27%).
| Demographics | Rating | Rank | Female Poverty |
| Kenyans | 43.8 /100 | #183 | Average 13.5% |
| Immigrants | Sierra Leone | 43.2 /100 | #184 | Average 13.5% |
| Immigrants | Cameroon | 42.0 /100 | #185 | Average 13.5% |
| Immigrants | Portugal | 41.5 /100 | #186 | Average 13.6% |
| Immigrants | Venezuela | 41.0 /100 | #187 | Average 13.6% |
| Hawaiians | 39.9 /100 | #188 | Fair 13.6% |
| Uruguayans | 39.8 /100 | #189 | Fair 13.6% |
| Sierra Leoneans | 33.1 /100 | #190 | Fair 13.7% |
| Immigrants | Kuwait | 32.7 /100 | #191 | Fair 13.7% |
| Immigrants | Costa Rica | 31.9 /100 | #192 | Fair 13.7% |
| Iraqis | 31.8 /100 | #193 | Fair 13.7% |
| Delaware | 31.1 /100 | #194 | Fair 13.7% |
| Immigrants | South America | 30.6 /100 | #195 | Fair 13.7% |
| South American Indians | 28.9 /100 | #196 | Fair 13.7% |
| Arabs | 28.6 /100 | #197 | Fair 13.7% |