Immigrants from Netherlands vs Senegalese Female Poverty
COMPARE
Immigrants from Netherlands
Senegalese
Female Poverty
Female Poverty Comparison
Immigrants from Netherlands
Senegalese
12.2%
FEMALE POVERTY
97.8/ 100
METRIC RATING
68th/ 347
METRIC RANK
16.5%
FEMALE POVERTY
0.0/ 100
METRIC RATING
295th/ 347
METRIC RANK
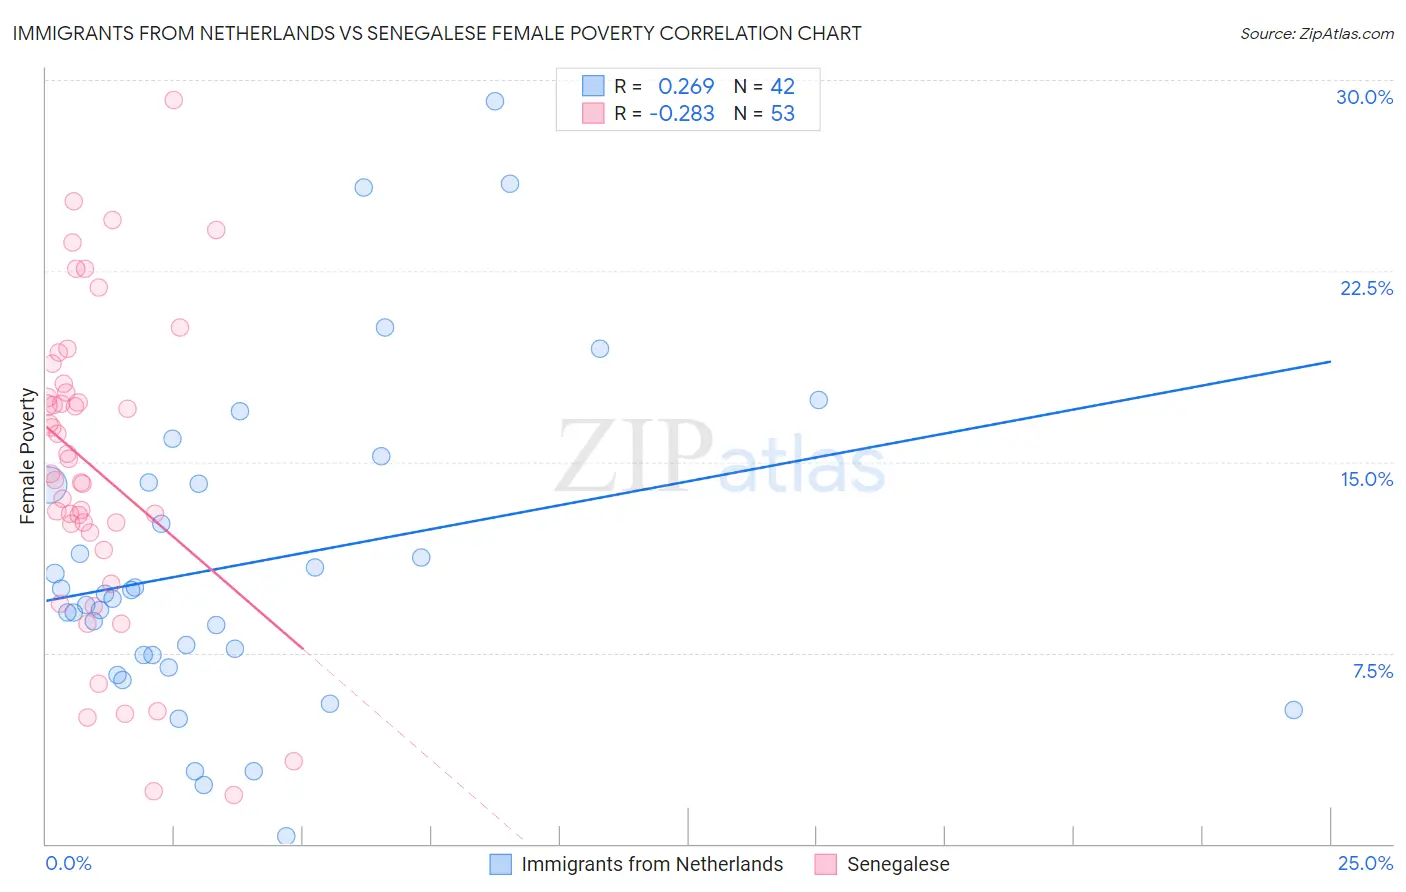
Immigrants from Netherlands vs Senegalese Female Poverty Correlation Chart
The statistical analysis conducted on geographies consisting of 237,788,507 people shows a weak positive correlation between the proportion of Immigrants from Netherlands and poverty level among females in the United States with a correlation coefficient (R) of 0.269 and weighted average of 12.2%. Similarly, the statistical analysis conducted on geographies consisting of 78,099,565 people shows a weak negative correlation between the proportion of Senegalese and poverty level among females in the United States with a correlation coefficient (R) of -0.283 and weighted average of 16.5%, a difference of 34.7%.
Female Poverty Correlation Summary
| Measurement | Immigrants from Netherlands | Senegalese |
| Minimum | 0.30% | 1.9% |
| Maximum | 29.1% | 29.2% |
| Range | 28.8% | 27.3% |
| Mean | 11.0% | 14.7% |
| Median | 9.7% | 14.5% |
| Interquartile 25% (IQ1) | 7.4% | 11.9% |
| Interquartile 75% (IQ3) | 14.1% | 17.9% |
| Interquartile Range (IQR) | 6.7% | 6.0% |
| Standard Deviation (Sample) | 6.3% | 6.1% |
| Standard Deviation (Population) | 6.2% | 6.0% |
Similar Demographics by Female Poverty
Demographics Similar to Immigrants from Netherlands by Female Poverty
In terms of female poverty, the demographic groups most similar to Immigrants from Netherlands are Immigrants from Eastern Asia (12.2%, a difference of 0.040%), Swiss (12.2%, a difference of 0.10%), Immigrants from Belgium (12.2%, a difference of 0.13%), Austrian (12.2%, a difference of 0.17%), and Indian (Asian) (12.2%, a difference of 0.18%).
| Demographics | Rating | Rank | Female Poverty |
| Immigrants | Asia | 98.1 /100 | #61 | Exceptional 12.2% |
| Immigrants | Italy | 98.0 /100 | #62 | Exceptional 12.2% |
| Ukrainians | 98.0 /100 | #63 | Exceptional 12.2% |
| Germans | 98.0 /100 | #64 | Exceptional 12.2% |
| Indians (Asian) | 97.9 /100 | #65 | Exceptional 12.2% |
| Austrians | 97.9 /100 | #66 | Exceptional 12.2% |
| Immigrants | Eastern Asia | 97.8 /100 | #67 | Exceptional 12.2% |
| Immigrants | Netherlands | 97.8 /100 | #68 | Exceptional 12.2% |
| Swiss | 97.7 /100 | #69 | Exceptional 12.2% |
| Immigrants | Belgium | 97.7 /100 | #70 | Exceptional 12.2% |
| Carpatho Rusyns | 97.6 /100 | #71 | Exceptional 12.2% |
| Cambodians | 97.5 /100 | #72 | Exceptional 12.2% |
| Zimbabweans | 97.5 /100 | #73 | Exceptional 12.3% |
| Immigrants | Canada | 97.5 /100 | #74 | Exceptional 12.3% |
| Europeans | 97.4 /100 | #75 | Exceptional 12.3% |
Demographics Similar to Senegalese by Female Poverty
In terms of female poverty, the demographic groups most similar to Senegalese are Immigrants from Senegal (16.5%, a difference of 0.020%), Immigrants from Cabo Verde (16.4%, a difference of 0.080%), Immigrants from Latin America (16.4%, a difference of 0.11%), Immigrants from Zaire (16.4%, a difference of 0.17%), and Yaqui (16.4%, a difference of 0.18%).
| Demographics | Rating | Rank | Female Poverty |
| Indonesians | 0.0 /100 | #288 | Tragic 16.4% |
| Blackfeet | 0.0 /100 | #289 | Tragic 16.4% |
| Immigrants | Bangladesh | 0.0 /100 | #290 | Tragic 16.4% |
| Yaqui | 0.0 /100 | #291 | Tragic 16.4% |
| Immigrants | Zaire | 0.0 /100 | #292 | Tragic 16.4% |
| Immigrants | Latin America | 0.0 /100 | #293 | Tragic 16.4% |
| Immigrants | Cabo Verde | 0.0 /100 | #294 | Tragic 16.4% |
| Senegalese | 0.0 /100 | #295 | Tragic 16.5% |
| Immigrants | Senegal | 0.0 /100 | #296 | Tragic 16.5% |
| Mexicans | 0.0 /100 | #297 | Tragic 16.5% |
| Somalis | 0.0 /100 | #298 | Tragic 16.6% |
| Hispanics or Latinos | 0.0 /100 | #299 | Tragic 16.6% |
| Bahamians | 0.0 /100 | #300 | Tragic 16.6% |
| Guatemalans | 0.0 /100 | #301 | Tragic 16.7% |
| Chippewa | 0.0 /100 | #302 | Tragic 16.7% |