Native/Alaskan vs Guamanian/Chamorro Single Father Poverty
COMPARE
Native/Alaskan
Guamanian/Chamorro
Single Father Poverty
Single Father Poverty Comparison
Natives/Alaskans
Guamanians/Chamorros
22.4%
SINGLE FATHER POVERTY
0.0/ 100
METRIC RATING
333rd/ 347
METRIC RANK
15.1%
SINGLE FATHER POVERTY
99.9/ 100
METRIC RATING
59th/ 347
METRIC RANK
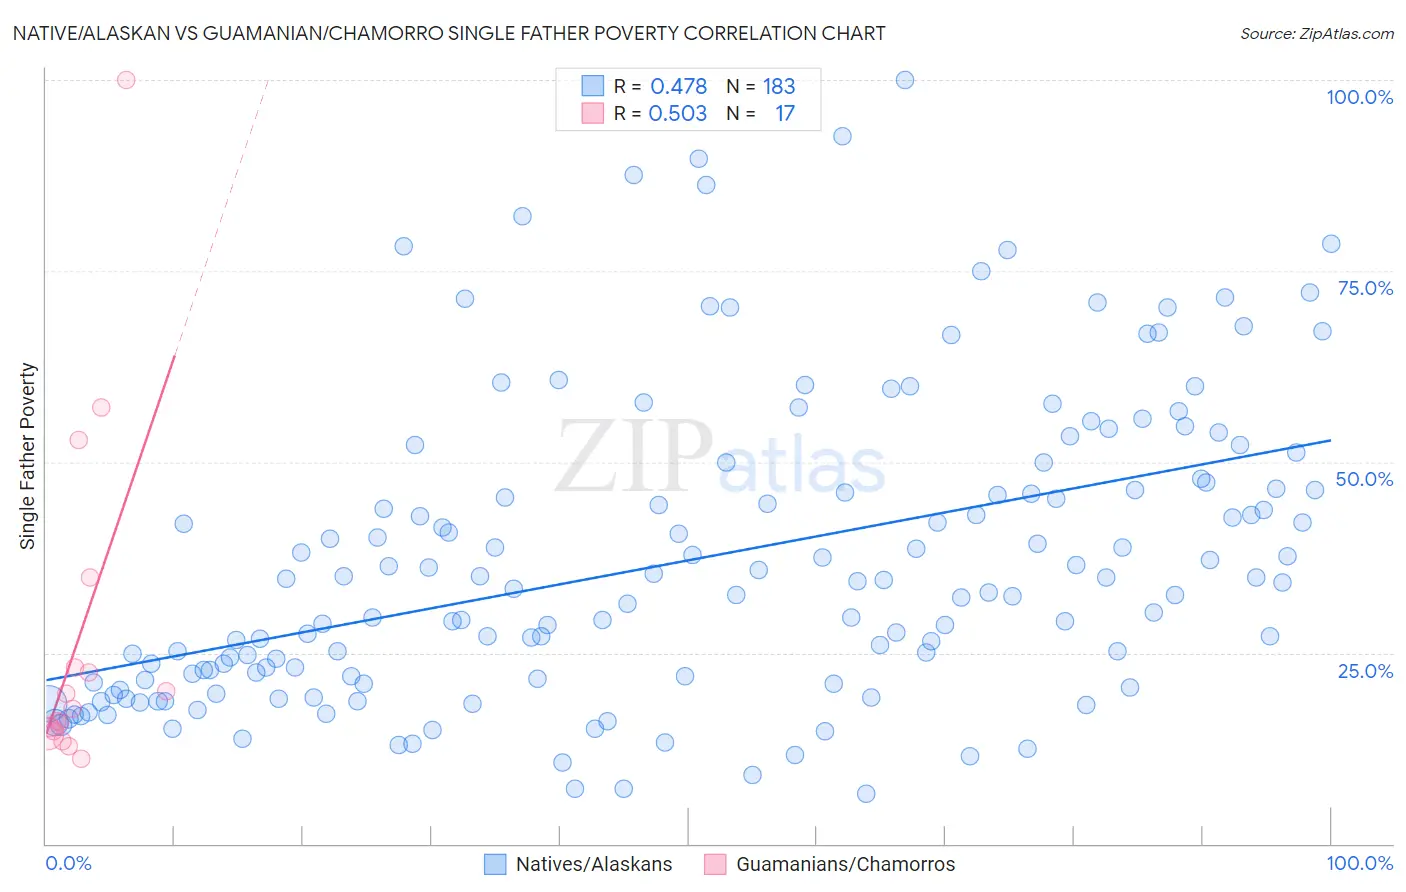
Native/Alaskan vs Guamanian/Chamorro Single Father Poverty Correlation Chart
The statistical analysis conducted on geographies consisting of 389,194,675 people shows a moderate positive correlation between the proportion of Natives/Alaskans and poverty level among single fathers in the United States with a correlation coefficient (R) of 0.478 and weighted average of 22.4%. Similarly, the statistical analysis conducted on geographies consisting of 191,371,634 people shows a substantial positive correlation between the proportion of Guamanians/Chamorros and poverty level among single fathers in the United States with a correlation coefficient (R) of 0.503 and weighted average of 15.1%, a difference of 48.3%.
Single Father Poverty Correlation Summary
| Measurement | Native/Alaskan | Guamanian/Chamorro |
| Minimum | 6.5% | 11.2% |
| Maximum | 100.0% | 100.0% |
| Range | 93.5% | 88.8% |
| Mean | 37.0% | 27.1% |
| Median | 33.3% | 17.6% |
| Interquartile 25% (IQ1) | 21.4% | 14.6% |
| Interquartile 75% (IQ3) | 46.5% | 29.0% |
| Interquartile Range (IQR) | 25.1% | 14.4% |
| Standard Deviation (Sample) | 19.7% | 23.1% |
| Standard Deviation (Population) | 19.7% | 22.4% |
Similar Demographics by Single Father Poverty
Demographics Similar to Natives/Alaskans by Single Father Poverty
In terms of single father poverty, the demographic groups most similar to Natives/Alaskans are Kiowa (22.5%, a difference of 0.36%), Tohono O'odham (22.0%, a difference of 1.7%), Shoshone (22.9%, a difference of 2.3%), Cajun (23.1%, a difference of 3.0%), and Central American Indian (21.7%, a difference of 3.3%).
| Demographics | Rating | Rank | Single Father Poverty |
| Immigrants | Yemen | 0.0 /100 | #326 | Tragic 20.6% |
| Choctaw | 0.0 /100 | #327 | Tragic 20.7% |
| Pueblo | 0.0 /100 | #328 | Tragic 21.1% |
| Colville | 0.0 /100 | #329 | Tragic 21.4% |
| Paiute | 0.0 /100 | #330 | Tragic 21.6% |
| Central American Indians | 0.0 /100 | #331 | Tragic 21.7% |
| Tohono O'odham | 0.0 /100 | #332 | Tragic 22.0% |
| Natives/Alaskans | 0.0 /100 | #333 | Tragic 22.4% |
| Kiowa | 0.0 /100 | #334 | Tragic 22.5% |
| Shoshone | 0.0 /100 | #335 | Tragic 22.9% |
| Cajuns | 0.0 /100 | #336 | Tragic 23.1% |
| Sioux | 0.0 /100 | #337 | Tragic 23.9% |
| Arapaho | 0.0 /100 | #338 | Tragic 24.0% |
| Apache | 0.0 /100 | #339 | Tragic 24.2% |
| Houma | 0.0 /100 | #340 | Tragic 26.7% |
Demographics Similar to Guamanians/Chamorros by Single Father Poverty
In terms of single father poverty, the demographic groups most similar to Guamanians/Chamorros are Hawaiian (15.1%, a difference of 0.10%), Laotian (15.1%, a difference of 0.15%), Immigrants from Laos (15.1%, a difference of 0.24%), Puget Sound Salish (15.2%, a difference of 0.40%), and Immigrants from Bosnia and Herzegovina (15.2%, a difference of 0.45%).
| Demographics | Rating | Rank | Single Father Poverty |
| Immigrants | El Salvador | 99.9 /100 | #52 | Exceptional 15.0% |
| Immigrants | Kenya | 99.9 /100 | #53 | Exceptional 15.0% |
| Immigrants | Uzbekistan | 99.9 /100 | #54 | Exceptional 15.0% |
| Immigrants | Bulgaria | 99.9 /100 | #55 | Exceptional 15.0% |
| Immigrants | Laos | 99.9 /100 | #56 | Exceptional 15.1% |
| Laotians | 99.9 /100 | #57 | Exceptional 15.1% |
| Hawaiians | 99.9 /100 | #58 | Exceptional 15.1% |
| Guamanians/Chamorros | 99.9 /100 | #59 | Exceptional 15.1% |
| Puget Sound Salish | 99.8 /100 | #60 | Exceptional 15.2% |
| Immigrants | Bosnia and Herzegovina | 99.8 /100 | #61 | Exceptional 15.2% |
| Immigrants | Armenia | 99.8 /100 | #62 | Exceptional 15.2% |
| Immigrants | Sweden | 99.8 /100 | #63 | Exceptional 15.2% |
| Bangladeshis | 99.8 /100 | #64 | Exceptional 15.2% |
| Immigrants | Malaysia | 99.8 /100 | #65 | Exceptional 15.2% |
| Immigrants | Moldova | 99.8 /100 | #66 | Exceptional 15.2% |