Native/Alaskan vs Korean Householder Income Under 25 years
COMPARE
Native/Alaskan
Korean
Householder Income Under 25 years
Householder Income Under 25 years Comparison
Natives/Alaskans
Koreans
$47,704
HOUSEHOLDER INCOME UNDER 25 YEARS
0.0/ 100
METRIC RATING
306th/ 347
METRIC RANK
$57,730
HOUSEHOLDER INCOME UNDER 25 YEARS
100.0/ 100
METRIC RATING
15th/ 347
METRIC RANK
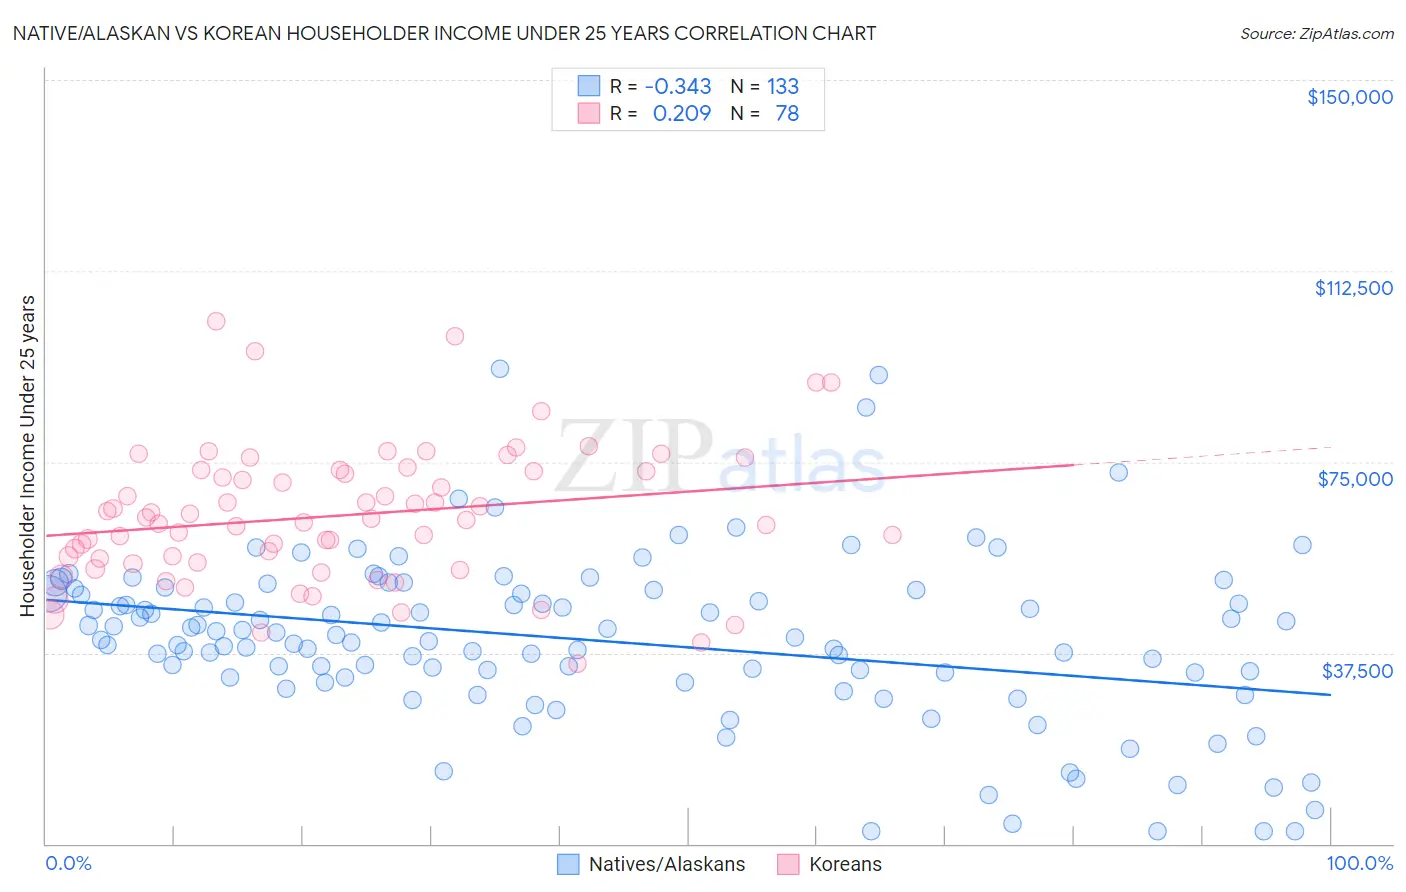
Native/Alaskan vs Korean Householder Income Under 25 years Correlation Chart
The statistical analysis conducted on geographies consisting of 416,135,889 people shows a mild negative correlation between the proportion of Natives/Alaskans and household income with householder under the age of 25 in the United States with a correlation coefficient (R) of -0.343 and weighted average of $47,704. Similarly, the statistical analysis conducted on geographies consisting of 413,031,760 people shows a weak positive correlation between the proportion of Koreans and household income with householder under the age of 25 in the United States with a correlation coefficient (R) of 0.209 and weighted average of $57,730, a difference of 21.0%.
Householder Income Under 25 years Correlation Summary
| Measurement | Native/Alaskan | Korean |
| Minimum | $2,499 | $35,240 |
| Maximum | $93,365 | $102,679 |
| Range | $90,866 | $67,439 |
| Mean | $40,011 | $64,423 |
| Median | $40,469 | $63,619 |
| Interquartile 25% (IQ1) | $32,640 | $55,260 |
| Interquartile 75% (IQ3) | $49,547 | $73,277 |
| Interquartile Range (IQR) | $16,907 | $18,017 |
| Standard Deviation (Sample) | $16,339 | $13,448 |
| Standard Deviation (Population) | $16,277 | $13,362 |
Similar Demographics by Householder Income Under 25 years
Demographics Similar to Natives/Alaskans by Householder Income Under 25 years
In terms of householder income under 25 years, the demographic groups most similar to Natives/Alaskans are Bangladeshi ($47,589, a difference of 0.24%), Cherokee ($47,848, a difference of 0.30%), Comanche ($47,518, a difference of 0.39%), Menominee ($47,907, a difference of 0.43%), and Immigrants from Middle Africa ($47,916, a difference of 0.44%).
| Demographics | Rating | Rank | Householder Income Under 25 years |
| Immigrants | Honduras | 0.0 /100 | #299 | Tragic $48,267 |
| Immigrants | Somalia | 0.0 /100 | #300 | Tragic $48,135 |
| Immigrants | Kuwait | 0.0 /100 | #301 | Tragic $48,126 |
| Immigrants | Liberia | 0.0 /100 | #302 | Tragic $47,981 |
| Immigrants | Middle Africa | 0.0 /100 | #303 | Tragic $47,916 |
| Menominee | 0.0 /100 | #304 | Tragic $47,907 |
| Cherokee | 0.0 /100 | #305 | Tragic $47,848 |
| Natives/Alaskans | 0.0 /100 | #306 | Tragic $47,704 |
| Bangladeshis | 0.0 /100 | #307 | Tragic $47,589 |
| Comanche | 0.0 /100 | #308 | Tragic $47,518 |
| U.S. Virgin Islanders | 0.0 /100 | #309 | Tragic $47,448 |
| Iroquois | 0.0 /100 | #310 | Tragic $47,380 |
| Ottawa | 0.0 /100 | #311 | Tragic $47,366 |
| Bermudans | 0.0 /100 | #312 | Tragic $47,359 |
| Delaware | 0.0 /100 | #313 | Tragic $47,159 |
Demographics Similar to Koreans by Householder Income Under 25 years
In terms of householder income under 25 years, the demographic groups most similar to Koreans are Filipino ($57,740, a difference of 0.020%), Immigrants from South Central Asia ($57,818, a difference of 0.15%), Immigrants from China ($57,931, a difference of 0.35%), Immigrants from Philippines ($57,930, a difference of 0.35%), and Immigrants from Afghanistan ($57,478, a difference of 0.44%).
| Demographics | Rating | Rank | Householder Income Under 25 years |
| Indians (Asian) | 100.0 /100 | #8 | Exceptional $58,239 |
| Chinese | 100.0 /100 | #9 | Exceptional $58,162 |
| Afghans | 100.0 /100 | #10 | Exceptional $58,019 |
| Immigrants | China | 100.0 /100 | #11 | Exceptional $57,931 |
| Immigrants | Philippines | 100.0 /100 | #12 | Exceptional $57,930 |
| Immigrants | South Central Asia | 100.0 /100 | #13 | Exceptional $57,818 |
| Filipinos | 100.0 /100 | #14 | Exceptional $57,740 |
| Koreans | 100.0 /100 | #15 | Exceptional $57,730 |
| Immigrants | Afghanistan | 100.0 /100 | #16 | Exceptional $57,478 |
| Sierra Leoneans | 100.0 /100 | #17 | Exceptional $57,272 |
| Immigrants | Eastern Asia | 100.0 /100 | #18 | Exceptional $57,123 |
| Bhutanese | 100.0 /100 | #19 | Exceptional $57,078 |
| Immigrants | Ireland | 100.0 /100 | #20 | Exceptional $57,075 |
| Immigrants | Fiji | 100.0 /100 | #21 | Exceptional $57,074 |
| Asians | 100.0 /100 | #22 | Exceptional $57,003 |