Native/Alaskan vs Immigrants from Israel Single Father Poverty
COMPARE
Native/Alaskan
Immigrants from Israel
Single Father Poverty
Single Father Poverty Comparison
Natives/Alaskans
Immigrants from Israel
22.4%
SINGLE FATHER POVERTY
0.0/ 100
METRIC RATING
333rd/ 347
METRIC RANK
16.1%
SINGLE FATHER POVERTY
72.0/ 100
METRIC RATING
153rd/ 347
METRIC RANK
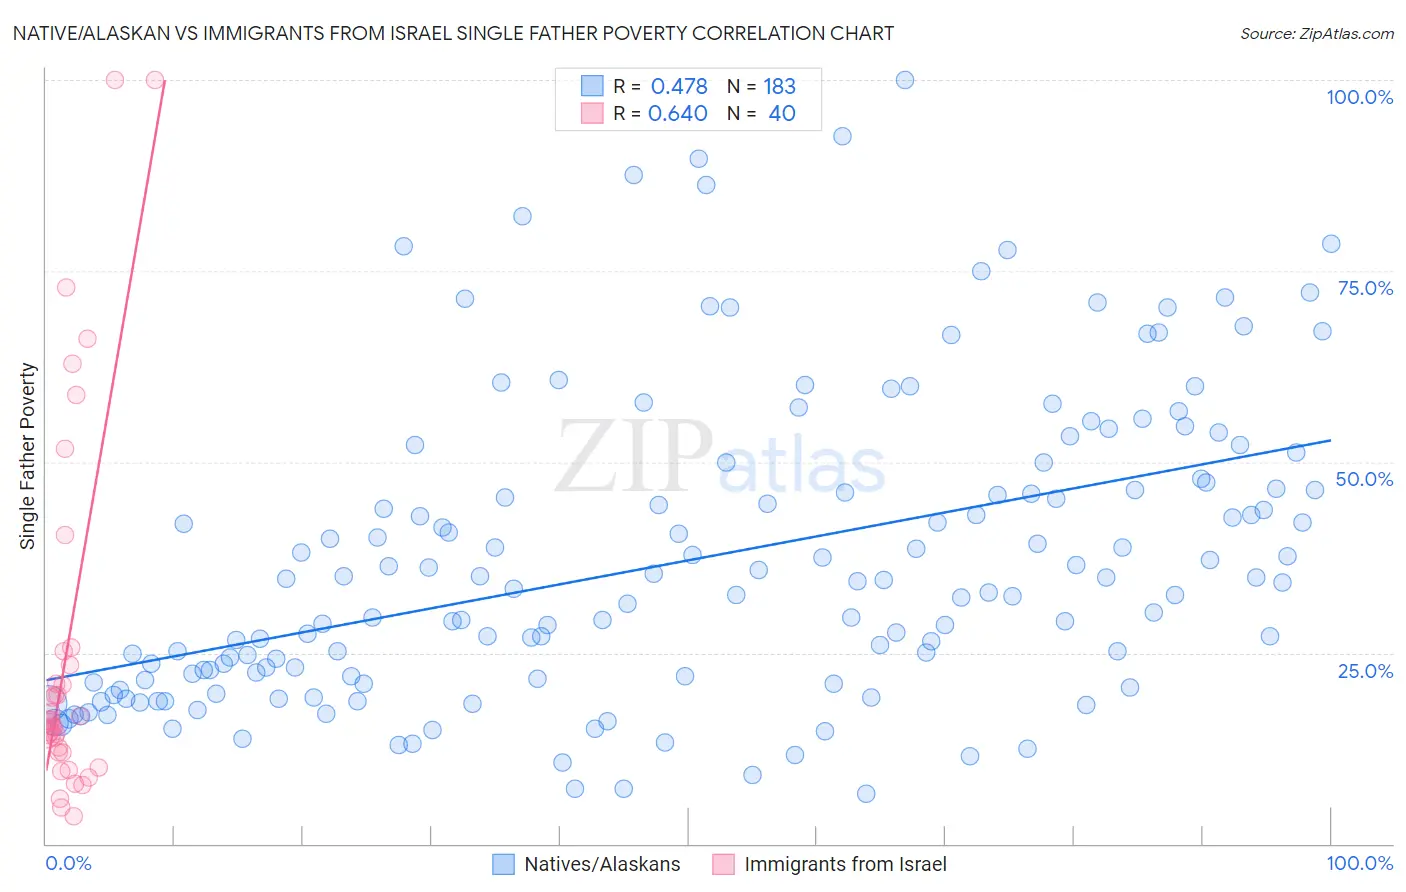
Native/Alaskan vs Immigrants from Israel Single Father Poverty Correlation Chart
The statistical analysis conducted on geographies consisting of 389,194,675 people shows a moderate positive correlation between the proportion of Natives/Alaskans and poverty level among single fathers in the United States with a correlation coefficient (R) of 0.478 and weighted average of 22.4%. Similarly, the statistical analysis conducted on geographies consisting of 172,515,206 people shows a significant positive correlation between the proportion of Immigrants from Israel and poverty level among single fathers in the United States with a correlation coefficient (R) of 0.640 and weighted average of 16.1%, a difference of 38.9%.
Single Father Poverty Correlation Summary
| Measurement | Native/Alaskan | Immigrants from Israel |
| Minimum | 6.5% | 3.6% |
| Maximum | 100.0% | 100.0% |
| Range | 93.5% | 96.4% |
| Mean | 37.0% | 25.4% |
| Median | 33.3% | 16.0% |
| Interquartile 25% (IQ1) | 21.4% | 11.9% |
| Interquartile 75% (IQ3) | 46.5% | 24.3% |
| Interquartile Range (IQR) | 25.1% | 12.4% |
| Standard Deviation (Sample) | 19.7% | 24.4% |
| Standard Deviation (Population) | 19.7% | 24.1% |
Similar Demographics by Single Father Poverty
Demographics Similar to Natives/Alaskans by Single Father Poverty
In terms of single father poverty, the demographic groups most similar to Natives/Alaskans are Kiowa (22.5%, a difference of 0.36%), Tohono O'odham (22.0%, a difference of 1.7%), Shoshone (22.9%, a difference of 2.3%), Cajun (23.1%, a difference of 3.0%), and Central American Indian (21.7%, a difference of 3.3%).
| Demographics | Rating | Rank | Single Father Poverty |
| Immigrants | Yemen | 0.0 /100 | #326 | Tragic 20.6% |
| Choctaw | 0.0 /100 | #327 | Tragic 20.7% |
| Pueblo | 0.0 /100 | #328 | Tragic 21.1% |
| Colville | 0.0 /100 | #329 | Tragic 21.4% |
| Paiute | 0.0 /100 | #330 | Tragic 21.6% |
| Central American Indians | 0.0 /100 | #331 | Tragic 21.7% |
| Tohono O'odham | 0.0 /100 | #332 | Tragic 22.0% |
| Natives/Alaskans | 0.0 /100 | #333 | Tragic 22.4% |
| Kiowa | 0.0 /100 | #334 | Tragic 22.5% |
| Shoshone | 0.0 /100 | #335 | Tragic 22.9% |
| Cajuns | 0.0 /100 | #336 | Tragic 23.1% |
| Sioux | 0.0 /100 | #337 | Tragic 23.9% |
| Arapaho | 0.0 /100 | #338 | Tragic 24.0% |
| Apache | 0.0 /100 | #339 | Tragic 24.2% |
| Houma | 0.0 /100 | #340 | Tragic 26.7% |
Demographics Similar to Immigrants from Israel by Single Father Poverty
In terms of single father poverty, the demographic groups most similar to Immigrants from Israel are Immigrants from Zimbabwe (16.1%, a difference of 0.0%), Immigrants from France (16.1%, a difference of 0.060%), Mexican (16.1%, a difference of 0.10%), Jordanian (16.1%, a difference of 0.13%), and South African (16.1%, a difference of 0.18%).
| Demographics | Rating | Rank | Single Father Poverty |
| Immigrants | Hungary | 78.3 /100 | #146 | Good 16.1% |
| Colombians | 77.1 /100 | #147 | Good 16.1% |
| Nigerians | 76.8 /100 | #148 | Good 16.1% |
| South Africans | 75.1 /100 | #149 | Good 16.1% |
| Jordanians | 74.2 /100 | #150 | Good 16.1% |
| Immigrants | France | 73.1 /100 | #151 | Good 16.1% |
| Immigrants | Zimbabwe | 72.1 /100 | #152 | Good 16.1% |
| Immigrants | Israel | 72.0 /100 | #153 | Good 16.1% |
| Mexicans | 70.1 /100 | #154 | Good 16.1% |
| Immigrants | Nicaragua | 67.8 /100 | #155 | Good 16.2% |
| Immigrants | Jordan | 66.0 /100 | #156 | Good 16.2% |
| Immigrants | Czechoslovakia | 62.8 /100 | #157 | Good 16.2% |
| Portuguese | 62.3 /100 | #158 | Good 16.2% |
| Belizeans | 59.9 /100 | #159 | Average 16.2% |
| Immigrants | Sudan | 59.8 /100 | #160 | Average 16.2% |