Mongolian vs Scottish Single Male Poverty
COMPARE
Mongolian
Scottish
Single Male Poverty
Single Male Poverty Comparison
Mongolians
Scottish
12.2%
SINGLE MALE POVERTY
97.7/ 100
METRIC RATING
95th/ 347
METRIC RANK
14.0%
SINGLE MALE POVERTY
0.1/ 100
METRIC RATING
269th/ 347
METRIC RANK
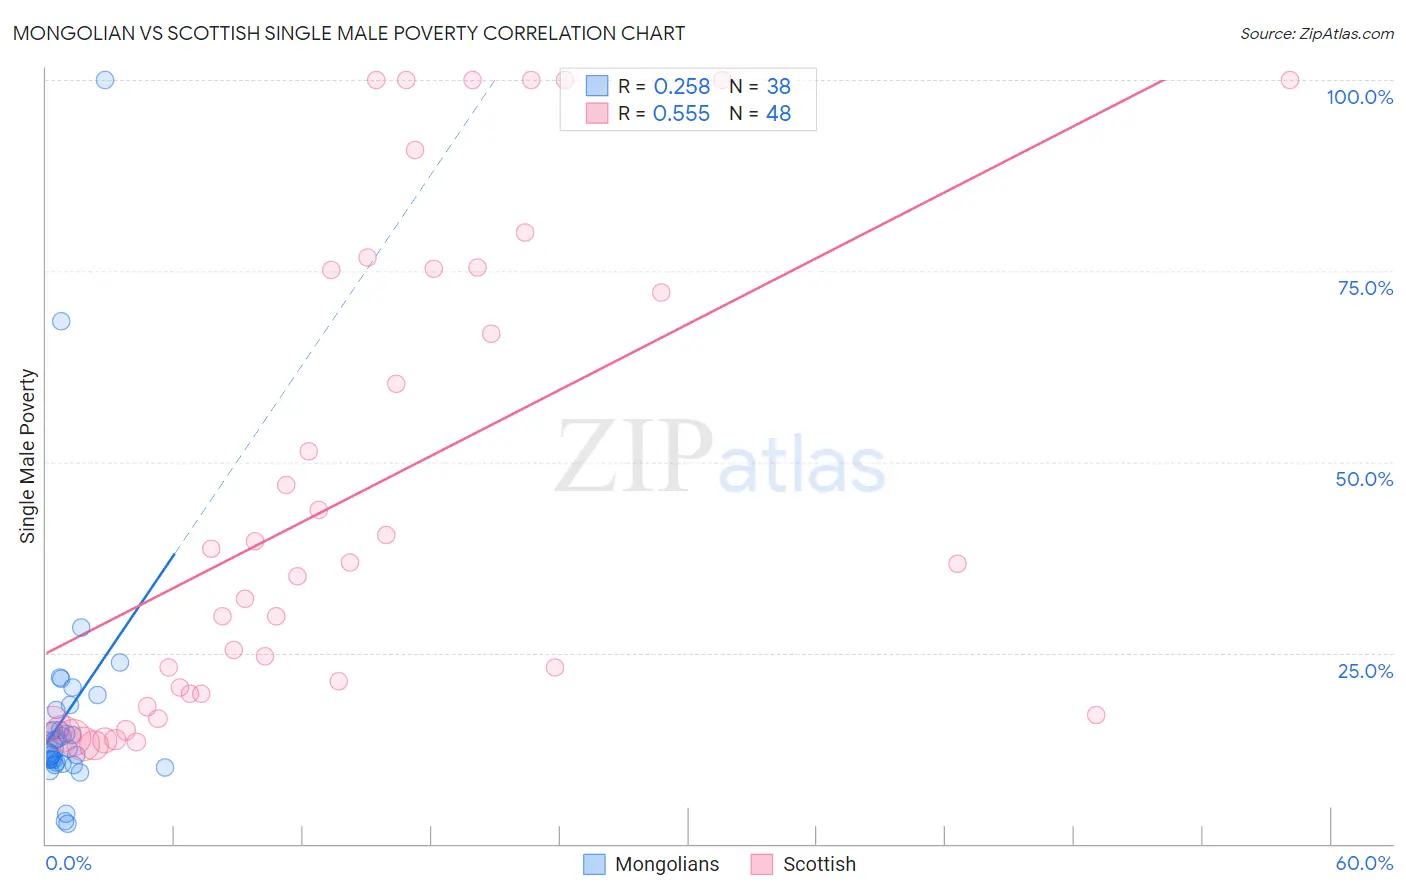
Mongolian vs Scottish Single Male Poverty Correlation Chart
The statistical analysis conducted on geographies consisting of 132,546,705 people shows a weak positive correlation between the proportion of Mongolians and poverty level among single males in the United States with a correlation coefficient (R) of 0.258 and weighted average of 12.2%. Similarly, the statistical analysis conducted on geographies consisting of 467,829,193 people shows a substantial positive correlation between the proportion of Scottish and poverty level among single males in the United States with a correlation coefficient (R) of 0.555 and weighted average of 14.0%, a difference of 14.8%.
Single Male Poverty Correlation Summary
| Measurement | Mongolian | Scottish |
| Minimum | 2.7% | 12.9% |
| Maximum | 100.0% | 100.0% |
| Range | 97.3% | 87.1% |
| Mean | 17.1% | 45.6% |
| Median | 12.5% | 35.9% |
| Interquartile 25% (IQ1) | 10.7% | 18.8% |
| Interquartile 75% (IQ3) | 17.6% | 75.2% |
| Interquartile Range (IQR) | 6.9% | 56.4% |
| Standard Deviation (Sample) | 17.3% | 31.3% |
| Standard Deviation (Population) | 17.0% | 30.9% |
Similar Demographics by Single Male Poverty
Demographics Similar to Mongolians by Single Male Poverty
In terms of single male poverty, the demographic groups most similar to Mongolians are Colombian (12.2%, a difference of 0.010%), Immigrants from Bosnia and Herzegovina (12.1%, a difference of 0.13%), Immigrants from Sweden (12.2%, a difference of 0.15%), Spanish American Indian (12.1%, a difference of 0.19%), and Immigrants from Italy (12.2%, a difference of 0.20%).
| Demographics | Rating | Rank | Single Male Poverty |
| Immigrants | Eritrea | 98.5 /100 | #88 | Exceptional 12.1% |
| Immigrants | Ireland | 98.3 /100 | #89 | Exceptional 12.1% |
| South American Indians | 98.3 /100 | #90 | Exceptional 12.1% |
| Immigrants | Turkey | 98.2 /100 | #91 | Exceptional 12.1% |
| Spanish American Indians | 98.0 /100 | #92 | Exceptional 12.1% |
| Immigrants | Bosnia and Herzegovina | 97.9 /100 | #93 | Exceptional 12.1% |
| Colombians | 97.8 /100 | #94 | Exceptional 12.2% |
| Mongolians | 97.7 /100 | #95 | Exceptional 12.2% |
| Immigrants | Sweden | 97.5 /100 | #96 | Exceptional 12.2% |
| Immigrants | Italy | 97.4 /100 | #97 | Exceptional 12.2% |
| Guamanians/Chamorros | 97.4 /100 | #98 | Exceptional 12.2% |
| Immigrants | Cuba | 97.3 /100 | #99 | Exceptional 12.2% |
| Immigrants | Australia | 97.1 /100 | #100 | Exceptional 12.2% |
| Immigrants | Latvia | 97.0 /100 | #101 | Exceptional 12.2% |
| Immigrants | Europe | 97.0 /100 | #102 | Exceptional 12.2% |
Demographics Similar to Scottish by Single Male Poverty
In terms of single male poverty, the demographic groups most similar to Scottish are Immigrants from Saudi Arabia (14.0%, a difference of 0.010%), Irish (14.0%, a difference of 0.040%), Mexican (14.0%, a difference of 0.10%), Immigrants from Mexico (13.9%, a difference of 0.16%), and German (13.9%, a difference of 0.22%).
| Demographics | Rating | Rank | Single Male Poverty |
| Fijians | 0.3 /100 | #262 | Tragic 13.8% |
| Cape Verdeans | 0.2 /100 | #263 | Tragic 13.8% |
| West Indians | 0.2 /100 | #264 | Tragic 13.8% |
| Immigrants | Congo | 0.2 /100 | #265 | Tragic 13.9% |
| Immigrants | Cabo Verde | 0.1 /100 | #266 | Tragic 13.9% |
| Germans | 0.1 /100 | #267 | Tragic 13.9% |
| Immigrants | Mexico | 0.1 /100 | #268 | Tragic 13.9% |
| Scottish | 0.1 /100 | #269 | Tragic 14.0% |
| Immigrants | Saudi Arabia | 0.1 /100 | #270 | Tragic 14.0% |
| Irish | 0.1 /100 | #271 | Tragic 14.0% |
| Mexicans | 0.1 /100 | #272 | Tragic 14.0% |
| Welsh | 0.1 /100 | #273 | Tragic 14.0% |
| Hondurans | 0.1 /100 | #274 | Tragic 14.0% |
| English | 0.1 /100 | #275 | Tragic 14.1% |
| Dutch | 0.1 /100 | #276 | Tragic 14.1% |