Mongolian vs Immigrants from Zimbabwe 4th Grade
COMPARE
Mongolian
Immigrants from Zimbabwe
4th Grade
4th Grade Comparison
Mongolians
Immigrants from Zimbabwe
97.5%
4TH GRADE
34.7/ 100
METRIC RATING
187th/ 347
METRIC RANK
97.8%
4TH GRADE
93.9/ 100
METRIC RATING
123rd/ 347
METRIC RANK
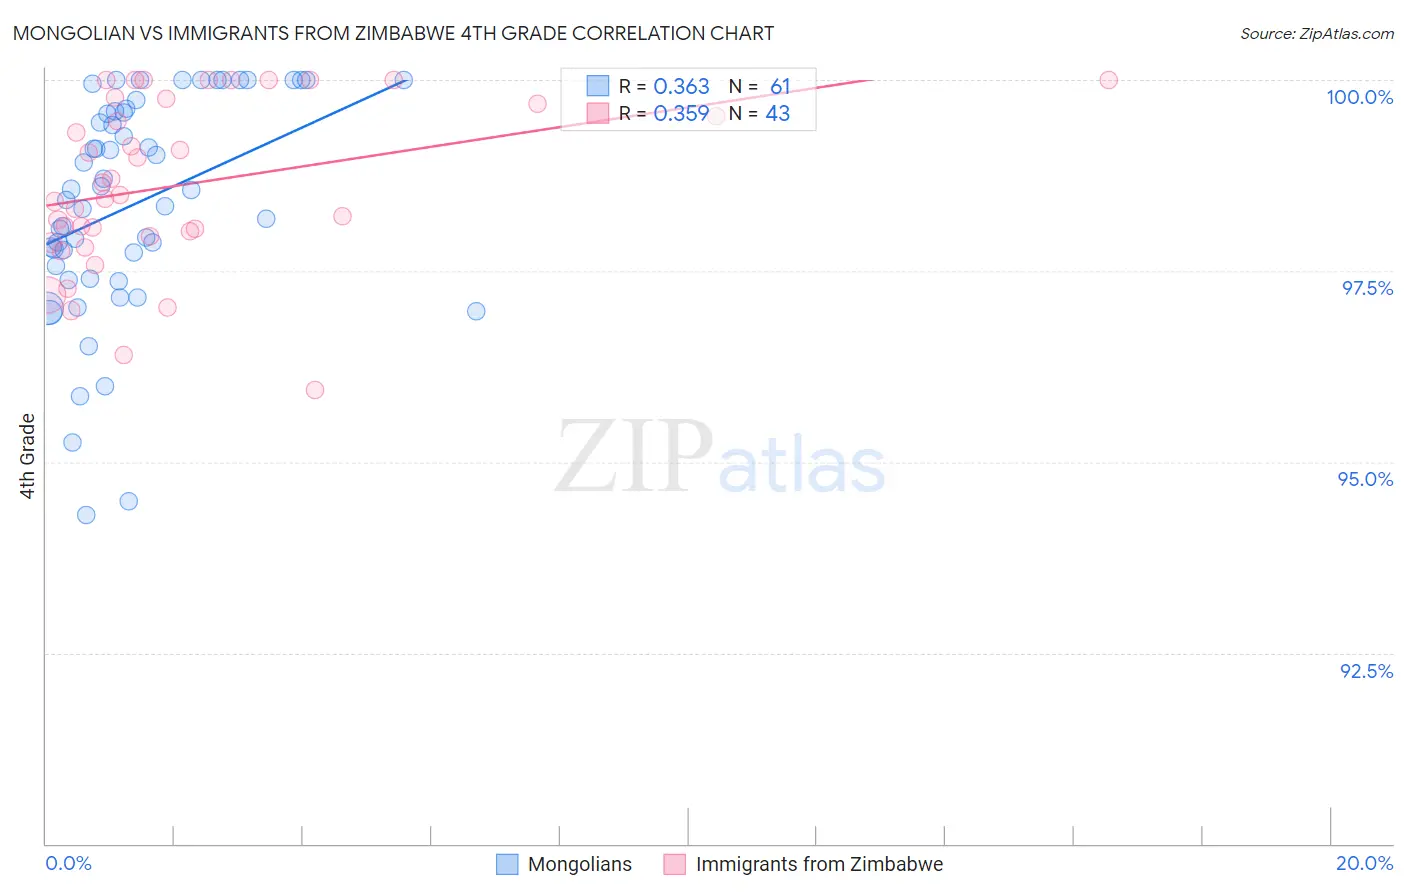
Mongolian vs Immigrants from Zimbabwe 4th Grade Correlation Chart
The statistical analysis conducted on geographies consisting of 140,362,004 people shows a mild positive correlation between the proportion of Mongolians and percentage of population with at least 4th grade education in the United States with a correlation coefficient (R) of 0.363 and weighted average of 97.5%. Similarly, the statistical analysis conducted on geographies consisting of 117,756,150 people shows a mild positive correlation between the proportion of Immigrants from Zimbabwe and percentage of population with at least 4th grade education in the United States with a correlation coefficient (R) of 0.359 and weighted average of 97.8%, a difference of 0.32%.
4th Grade Correlation Summary
| Measurement | Mongolian | Immigrants from Zimbabwe |
| Minimum | 94.3% | 95.9% |
| Maximum | 100.0% | 100.0% |
| Range | 5.7% | 4.1% |
| Mean | 98.4% | 98.6% |
| Median | 98.6% | 98.5% |
| Interquartile 25% (IQ1) | 97.5% | 98.0% |
| Interquartile 75% (IQ3) | 99.6% | 99.7% |
| Interquartile Range (IQR) | 2.1% | 1.8% |
| Standard Deviation (Sample) | 1.4% | 1.1% |
| Standard Deviation (Population) | 1.4% | 1.1% |
Similar Demographics by 4th Grade
Demographics Similar to Mongolians by 4th Grade
In terms of 4th grade, the demographic groups most similar to Mongolians are Immigrants from Kenya (97.5%, a difference of 0.0%), Dutch West Indian (97.5%, a difference of 0.0%), Immigrants from Argentina (97.5%, a difference of 0.0%), Pakistani (97.5%, a difference of 0.010%), and Panamanian (97.4%, a difference of 0.010%).
| Demographics | Rating | Rank | 4th Grade |
| Immigrants | Venezuela | 42.7 /100 | #180 | Average 97.5% |
| Immigrants | Taiwan | 41.5 /100 | #181 | Average 97.5% |
| Spanish Americans | 39.3 /100 | #182 | Fair 97.5% |
| Argentineans | 39.0 /100 | #183 | Fair 97.5% |
| Pakistanis | 36.2 /100 | #184 | Fair 97.5% |
| Immigrants | Kenya | 35.8 /100 | #185 | Fair 97.5% |
| Dutch West Indians | 35.8 /100 | #186 | Fair 97.5% |
| Mongolians | 34.7 /100 | #187 | Fair 97.5% |
| Immigrants | Argentina | 34.6 /100 | #188 | Fair 97.5% |
| Panamanians | 31.9 /100 | #189 | Fair 97.4% |
| Blacks/African Americans | 31.1 /100 | #190 | Fair 97.4% |
| Navajo | 30.7 /100 | #191 | Fair 97.4% |
| Immigrants | Ukraine | 30.1 /100 | #192 | Fair 97.4% |
| Immigrants | Egypt | 30.1 /100 | #193 | Fair 97.4% |
| Portuguese | 29.2 /100 | #194 | Fair 97.4% |
Demographics Similar to Immigrants from Zimbabwe by 4th Grade
In terms of 4th grade, the demographic groups most similar to Immigrants from Zimbabwe are Immigrants from Norway (97.8%, a difference of 0.0%), Immigrants from Japan (97.8%, a difference of 0.0%), Spanish (97.8%, a difference of 0.0%), Immigrants from France (97.8%, a difference of 0.010%), and Immigrants from Croatia (97.8%, a difference of 0.020%).
| Demographics | Rating | Rank | 4th Grade |
| Immigrants | Croatia | 95.2 /100 | #116 | Exceptional 97.8% |
| Syrians | 94.9 /100 | #117 | Exceptional 97.8% |
| Menominee | 94.9 /100 | #118 | Exceptional 97.8% |
| Immigrants | Saudi Arabia | 94.8 /100 | #119 | Exceptional 97.8% |
| Immigrants | France | 94.8 /100 | #120 | Exceptional 97.8% |
| Immigrants | Norway | 94.2 /100 | #121 | Exceptional 97.8% |
| Immigrants | Japan | 94.1 /100 | #122 | Exceptional 97.8% |
| Immigrants | Zimbabwe | 93.9 /100 | #123 | Exceptional 97.8% |
| Spanish | 93.7 /100 | #124 | Exceptional 97.8% |
| Immigrants | Serbia | 92.6 /100 | #125 | Exceptional 97.8% |
| Immigrants | Europe | 92.5 /100 | #126 | Exceptional 97.8% |
| Colville | 92.3 /100 | #127 | Exceptional 97.7% |
| Pima | 92.0 /100 | #128 | Exceptional 97.7% |
| Immigrants | Bulgaria | 91.3 /100 | #129 | Exceptional 97.7% |
| Immigrants | Romania | 90.6 /100 | #130 | Exceptional 97.7% |