Mongolian vs French Single Male Poverty
COMPARE
Mongolian
French
Single Male Poverty
Single Male Poverty Comparison
Mongolians
French
12.2%
SINGLE MALE POVERTY
97.7/ 100
METRIC RATING
95th/ 347
METRIC RANK
14.4%
SINGLE MALE POVERTY
0.0/ 100
METRIC RATING
285th/ 347
METRIC RANK
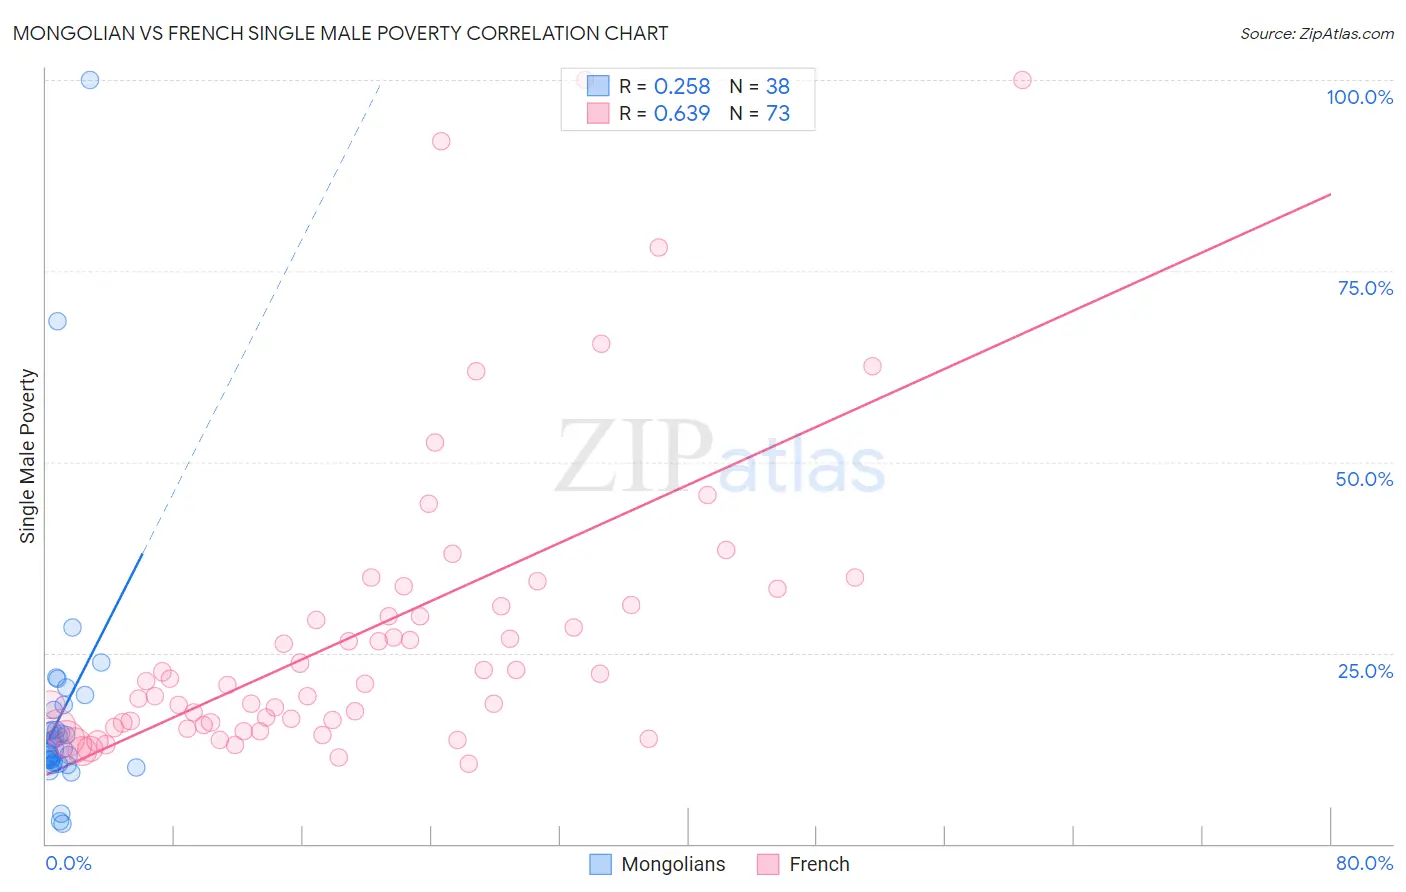
Mongolian vs French Single Male Poverty Correlation Chart
The statistical analysis conducted on geographies consisting of 132,546,705 people shows a weak positive correlation between the proportion of Mongolians and poverty level among single males in the United States with a correlation coefficient (R) of 0.258 and weighted average of 12.2%. Similarly, the statistical analysis conducted on geographies consisting of 472,532,664 people shows a significant positive correlation between the proportion of French and poverty level among single males in the United States with a correlation coefficient (R) of 0.639 and weighted average of 14.4%, a difference of 18.6%.
Single Male Poverty Correlation Summary
| Measurement | Mongolian | French |
| Minimum | 2.7% | 10.5% |
| Maximum | 100.0% | 100.0% |
| Range | 97.3% | 89.5% |
| Mean | 17.1% | 27.8% |
| Median | 12.5% | 20.9% |
| Interquartile 25% (IQ1) | 10.7% | 15.4% |
| Interquartile 75% (IQ3) | 17.6% | 31.2% |
| Interquartile Range (IQR) | 6.9% | 15.7% |
| Standard Deviation (Sample) | 17.3% | 19.9% |
| Standard Deviation (Population) | 17.0% | 19.7% |
Similar Demographics by Single Male Poverty
Demographics Similar to Mongolians by Single Male Poverty
In terms of single male poverty, the demographic groups most similar to Mongolians are Colombian (12.2%, a difference of 0.010%), Immigrants from Bosnia and Herzegovina (12.1%, a difference of 0.13%), Immigrants from Sweden (12.2%, a difference of 0.15%), Spanish American Indian (12.1%, a difference of 0.19%), and Immigrants from Italy (12.2%, a difference of 0.20%).
| Demographics | Rating | Rank | Single Male Poverty |
| Immigrants | Eritrea | 98.5 /100 | #88 | Exceptional 12.1% |
| Immigrants | Ireland | 98.3 /100 | #89 | Exceptional 12.1% |
| South American Indians | 98.3 /100 | #90 | Exceptional 12.1% |
| Immigrants | Turkey | 98.2 /100 | #91 | Exceptional 12.1% |
| Spanish American Indians | 98.0 /100 | #92 | Exceptional 12.1% |
| Immigrants | Bosnia and Herzegovina | 97.9 /100 | #93 | Exceptional 12.1% |
| Colombians | 97.8 /100 | #94 | Exceptional 12.2% |
| Mongolians | 97.7 /100 | #95 | Exceptional 12.2% |
| Immigrants | Sweden | 97.5 /100 | #96 | Exceptional 12.2% |
| Immigrants | Italy | 97.4 /100 | #97 | Exceptional 12.2% |
| Guamanians/Chamorros | 97.4 /100 | #98 | Exceptional 12.2% |
| Immigrants | Cuba | 97.3 /100 | #99 | Exceptional 12.2% |
| Immigrants | Australia | 97.1 /100 | #100 | Exceptional 12.2% |
| Immigrants | Latvia | 97.0 /100 | #101 | Exceptional 12.2% |
| Immigrants | Europe | 97.0 /100 | #102 | Exceptional 12.2% |
Demographics Similar to French by Single Male Poverty
In terms of single male poverty, the demographic groups most similar to French are Immigrants from Bahamas (14.4%, a difference of 0.13%), Celtic (14.5%, a difference of 0.32%), Iroquois (14.5%, a difference of 0.45%), White/Caucasian (14.5%, a difference of 0.45%), and Immigrants from Dominica (14.5%, a difference of 0.54%).
| Demographics | Rating | Rank | Single Male Poverty |
| Slovaks | 0.0 /100 | #278 | Tragic 14.1% |
| Indonesians | 0.0 /100 | #279 | Tragic 14.1% |
| Hmong | 0.0 /100 | #280 | Tragic 14.2% |
| Hispanics or Latinos | 0.0 /100 | #281 | Tragic 14.2% |
| Spanish Americans | 0.0 /100 | #282 | Tragic 14.2% |
| Yaqui | 0.0 /100 | #283 | Tragic 14.2% |
| Immigrants | Bahamas | 0.0 /100 | #284 | Tragic 14.4% |
| French | 0.0 /100 | #285 | Tragic 14.4% |
| Celtics | 0.0 /100 | #286 | Tragic 14.5% |
| Iroquois | 0.0 /100 | #287 | Tragic 14.5% |
| Whites/Caucasians | 0.0 /100 | #288 | Tragic 14.5% |
| Immigrants | Dominica | 0.0 /100 | #289 | Tragic 14.5% |
| U.S. Virgin Islanders | 0.0 /100 | #290 | Tragic 14.5% |
| Bahamians | 0.0 /100 | #291 | Tragic 14.6% |
| Immigrants | Nonimmigrants | 0.0 /100 | #292 | Tragic 14.6% |