Mongolian vs Immigrants from Zimbabwe Householder Income Under 25 years
COMPARE
Mongolian
Immigrants from Zimbabwe
Householder Income Under 25 years
Householder Income Under 25 years Comparison
Mongolians
Immigrants from Zimbabwe
$52,540
HOUSEHOLDER INCOME UNDER 25 YEARS
70.2/ 100
METRIC RATING
159th/ 347
METRIC RANK
$51,914
HOUSEHOLDER INCOME UNDER 25 YEARS
33.8/ 100
METRIC RATING
175th/ 347
METRIC RANK
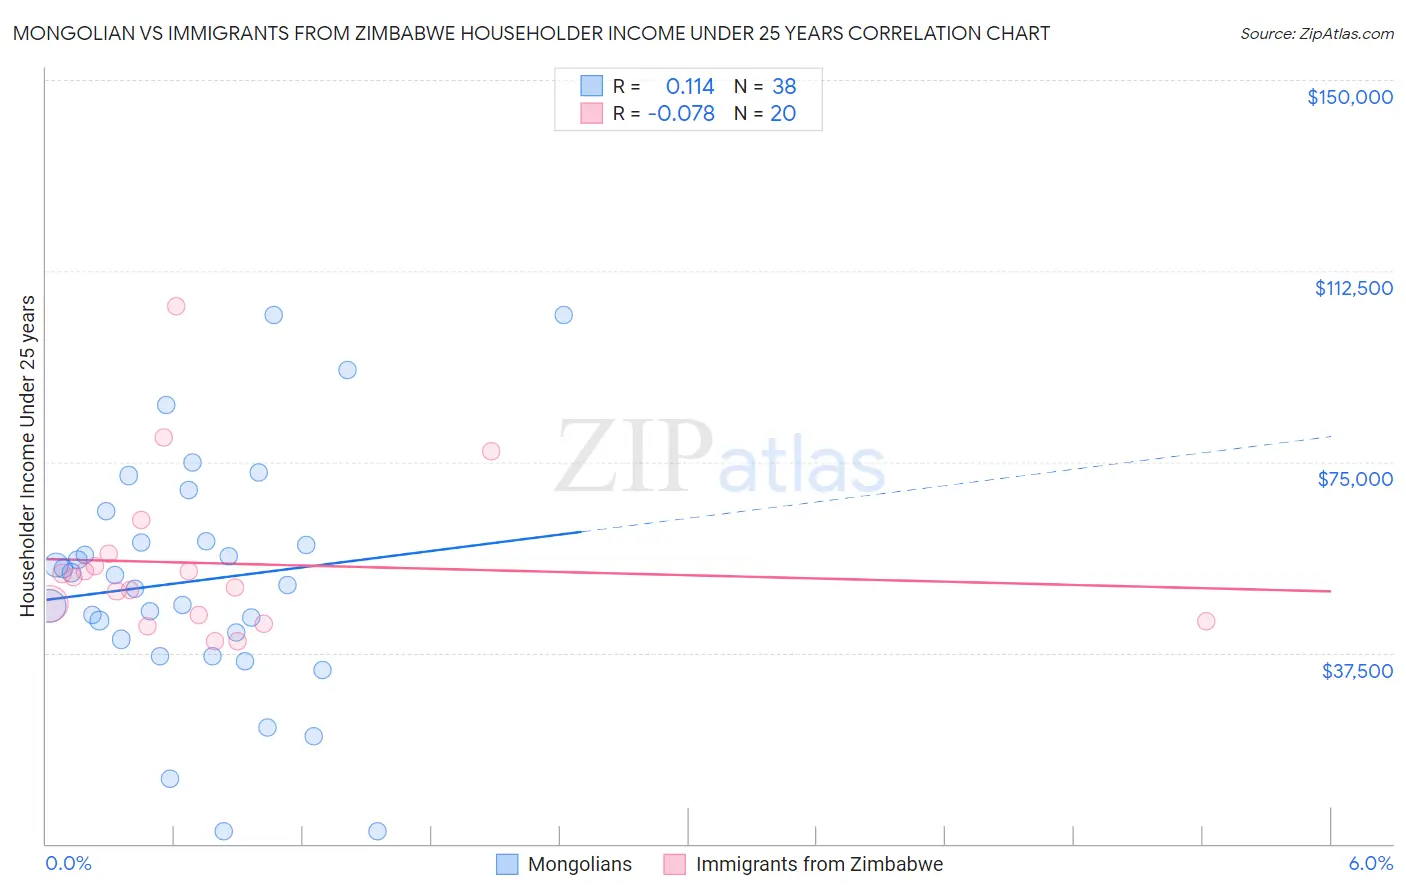
Mongolian vs Immigrants from Zimbabwe Householder Income Under 25 years Correlation Chart
The statistical analysis conducted on geographies consisting of 130,351,633 people shows a poor positive correlation between the proportion of Mongolians and household income with householder under the age of 25 in the United States with a correlation coefficient (R) of 0.114 and weighted average of $52,540. Similarly, the statistical analysis conducted on geographies consisting of 110,683,566 people shows a slight negative correlation between the proportion of Immigrants from Zimbabwe and household income with householder under the age of 25 in the United States with a correlation coefficient (R) of -0.078 and weighted average of $51,914, a difference of 1.2%.
Householder Income Under 25 years Correlation Summary
| Measurement | Mongolian | Immigrants from Zimbabwe |
| Minimum | $2,499 | $39,852 |
| Maximum | $103,839 | $105,520 |
| Range | $101,340 | $65,668 |
| Mean | $51,654 | $55,059 |
| Median | $51,754 | $51,281 |
| Interquartile 25% (IQ1) | $40,145 | $44,321 |
| Interquartile 75% (IQ3) | $59,299 | $55,822 |
| Interquartile Range (IQR) | $19,154 | $11,501 |
| Standard Deviation (Sample) | $23,318 | $16,003 |
| Standard Deviation (Population) | $23,009 | $15,598 |
Demographics Similar to Mongolians and Immigrants from Zimbabwe by Householder Income Under 25 years
In terms of householder income under 25 years, the demographic groups most similar to Mongolians are Immigrants from Turkey ($52,503, a difference of 0.070%), Ghanaian ($52,594, a difference of 0.10%), Immigrants from Netherlands ($52,592, a difference of 0.10%), Uruguayan ($52,465, a difference of 0.14%), and Immigrants from Cambodia ($52,450, a difference of 0.17%). Similarly, the demographic groups most similar to Immigrants from Zimbabwe are Austrian ($51,898, a difference of 0.030%), British West Indian ($51,844, a difference of 0.14%), Immigrants from Western Asia ($52,190, a difference of 0.53%), Barbadian ($52,202, a difference of 0.56%), and Cypriot ($52,209, a difference of 0.57%).
| Demographics | Rating | Rank | Householder Income Under 25 years |
| Ghanaians | 72.9 /100 | #157 | Good $52,594 |
| Immigrants | Netherlands | 72.8 /100 | #158 | Good $52,592 |
| Mongolians | 70.2 /100 | #159 | Good $52,540 |
| Immigrants | Turkey | 68.3 /100 | #160 | Good $52,503 |
| Uruguayans | 66.2 /100 | #161 | Good $52,465 |
| Immigrants | Cambodia | 65.4 /100 | #162 | Good $52,450 |
| Immigrants | Chile | 64.8 /100 | #163 | Good $52,440 |
| Immigrants | Trinidad and Tobago | 64.7 /100 | #164 | Good $52,437 |
| Poles | 63.0 /100 | #165 | Good $52,407 |
| Immigrants | Austria | 62.6 /100 | #166 | Good $52,400 |
| Immigrants | Uganda | 61.1 /100 | #167 | Good $52,374 |
| Japanese | 60.5 /100 | #168 | Good $52,365 |
| Canadians | 58.8 /100 | #169 | Average $52,336 |
| Israelis | 58.8 /100 | #170 | Average $52,335 |
| Immigrants | Uruguay | 56.8 /100 | #171 | Average $52,302 |
| Cypriots | 51.2 /100 | #172 | Average $52,209 |
| Barbadians | 50.8 /100 | #173 | Average $52,202 |
| Immigrants | Western Asia | 50.0 /100 | #174 | Average $52,190 |
| Immigrants | Zimbabwe | 33.8 /100 | #175 | Fair $51,914 |
| Austrians | 32.9 /100 | #176 | Fair $51,898 |
| British West Indians | 30.0 /100 | #177 | Fair $51,844 |