Mexican vs Immigrants from Uruguay Single Female Poverty
COMPARE
Mexican
Immigrants from Uruguay
Single Female Poverty
Single Female Poverty Comparison
Mexicans
Immigrants from Uruguay
25.0%
SINGLE FEMALE POVERTY
0.0/ 100
METRIC RATING
299th/ 347
METRIC RANK
20.6%
SINGLE FEMALE POVERTY
77.7/ 100
METRIC RATING
152nd/ 347
METRIC RANK
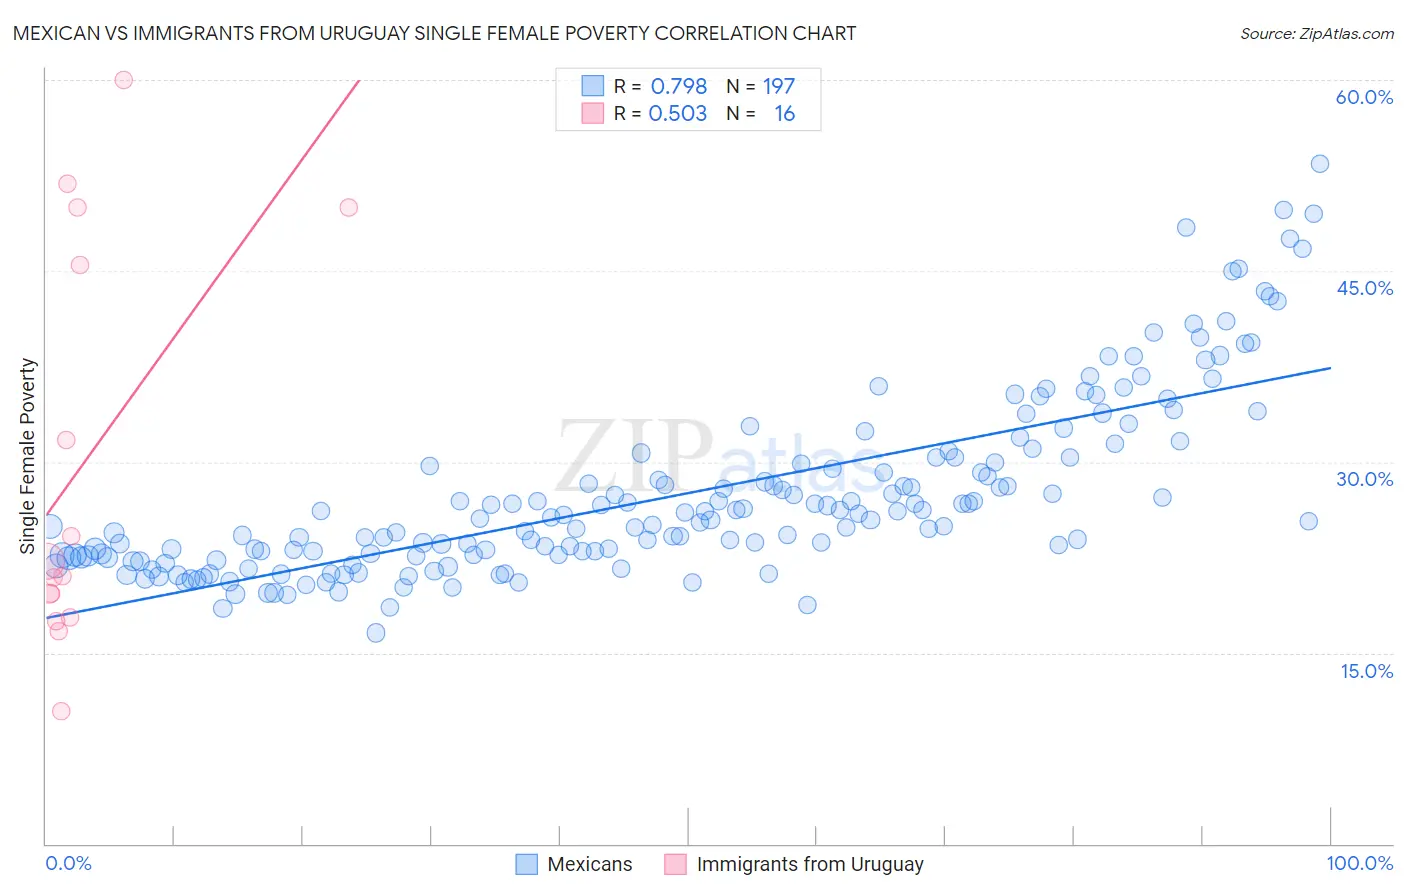
Mexican vs Immigrants from Uruguay Single Female Poverty Correlation Chart
The statistical analysis conducted on geographies consisting of 547,731,472 people shows a strong positive correlation between the proportion of Mexicans and poverty level among single females in the United States with a correlation coefficient (R) of 0.798 and weighted average of 25.0%. Similarly, the statistical analysis conducted on geographies consisting of 132,556,340 people shows a substantial positive correlation between the proportion of Immigrants from Uruguay and poverty level among single females in the United States with a correlation coefficient (R) of 0.503 and weighted average of 20.6%, a difference of 21.5%.
Single Female Poverty Correlation Summary
| Measurement | Mexican | Immigrants from Uruguay |
| Minimum | 16.6% | 10.4% |
| Maximum | 53.5% | 60.0% |
| Range | 36.9% | 49.6% |
| Mean | 27.4% | 29.9% |
| Median | 25.5% | 21.6% |
| Interquartile 25% (IQ1) | 22.6% | 18.7% |
| Interquartile 75% (IQ3) | 30.1% | 47.7% |
| Interquartile Range (IQR) | 7.5% | 29.0% |
| Standard Deviation (Sample) | 7.0% | 15.8% |
| Standard Deviation (Population) | 7.0% | 15.3% |
Similar Demographics by Single Female Poverty
Demographics Similar to Mexicans by Single Female Poverty
In terms of single female poverty, the demographic groups most similar to Mexicans are Blackfeet (25.1%, a difference of 0.080%), Honduran (25.1%, a difference of 0.25%), Shoshone (25.1%, a difference of 0.34%), Yaqui (24.9%, a difference of 0.67%), and Somali (25.2%, a difference of 0.74%).
| Demographics | Rating | Rank | Single Female Poverty |
| Alsatians | 0.0 /100 | #292 | Tragic 24.5% |
| Americans | 0.0 /100 | #293 | Tragic 24.5% |
| French American Indians | 0.0 /100 | #294 | Tragic 24.6% |
| Hispanics or Latinos | 0.0 /100 | #295 | Tragic 24.6% |
| Africans | 0.0 /100 | #296 | Tragic 24.8% |
| Immigrants | Central America | 0.0 /100 | #297 | Tragic 24.8% |
| Yaqui | 0.0 /100 | #298 | Tragic 24.9% |
| Mexicans | 0.0 /100 | #299 | Tragic 25.0% |
| Blackfeet | 0.0 /100 | #300 | Tragic 25.1% |
| Hondurans | 0.0 /100 | #301 | Tragic 25.1% |
| Shoshone | 0.0 /100 | #302 | Tragic 25.1% |
| Somalis | 0.0 /100 | #303 | Tragic 25.2% |
| Immigrants | Congo | 0.0 /100 | #304 | Tragic 25.3% |
| Immigrants | Dominican Republic | 0.0 /100 | #305 | Tragic 25.3% |
| Immigrants | Mexico | 0.0 /100 | #306 | Tragic 25.3% |
Demographics Similar to Immigrants from Uruguay by Single Female Poverty
In terms of single female poverty, the demographic groups most similar to Immigrants from Uruguay are Swedish (20.6%, a difference of 0.050%), Immigrants from Western Europe (20.6%, a difference of 0.080%), Samoan (20.6%, a difference of 0.15%), South American Indian (20.6%, a difference of 0.18%), and Puget Sound Salish (20.6%, a difference of 0.19%).
| Demographics | Rating | Rank | Single Female Poverty |
| Austrians | 85.8 /100 | #145 | Excellent 20.4% |
| Venezuelans | 85.5 /100 | #146 | Excellent 20.4% |
| South Africans | 85.3 /100 | #147 | Excellent 20.4% |
| Luxembourgers | 84.9 /100 | #148 | Excellent 20.4% |
| Portuguese | 81.5 /100 | #149 | Excellent 20.5% |
| Immigrants | Denmark | 80.5 /100 | #150 | Excellent 20.5% |
| Puget Sound Salish | 79.6 /100 | #151 | Good 20.6% |
| Immigrants | Uruguay | 77.7 /100 | #152 | Good 20.6% |
| Swedes | 77.1 /100 | #153 | Good 20.6% |
| Immigrants | Western Europe | 76.7 /100 | #154 | Good 20.6% |
| Samoans | 76.0 /100 | #155 | Good 20.6% |
| South American Indians | 75.7 /100 | #156 | Good 20.6% |
| Immigrants | Oceania | 74.3 /100 | #157 | Good 20.7% |
| Danes | 73.0 /100 | #158 | Good 20.7% |
| Costa Ricans | 71.8 /100 | #159 | Good 20.7% |