Mexican vs Immigrants from Uruguay Vision Disability
COMPARE
Mexican
Immigrants from Uruguay
Vision Disability
Vision Disability Comparison
Mexicans
Immigrants from Uruguay
2.5%
VISION DISABILITY
0.0/ 100
METRIC RATING
298th/ 347
METRIC RANK
2.2%
VISION DISABILITY
11.5/ 100
METRIC RATING
210th/ 347
METRIC RANK
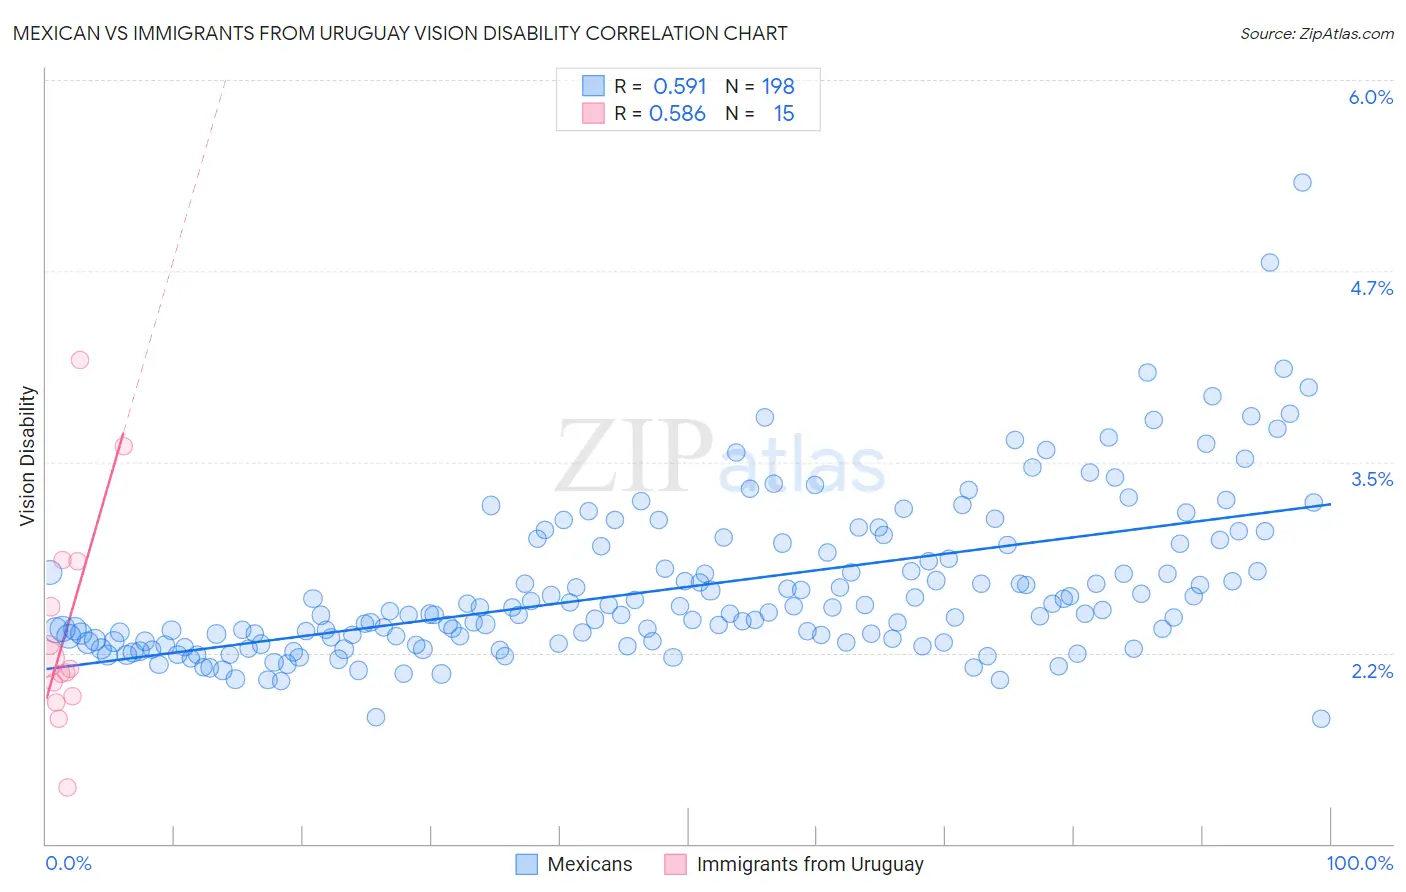
Mexican vs Immigrants from Uruguay Vision Disability Correlation Chart
The statistical analysis conducted on geographies consisting of 563,538,234 people shows a substantial positive correlation between the proportion of Mexicans and percentage of population with vision disability in the United States with a correlation coefficient (R) of 0.591 and weighted average of 2.5%. Similarly, the statistical analysis conducted on geographies consisting of 133,246,833 people shows a substantial positive correlation between the proportion of Immigrants from Uruguay and percentage of population with vision disability in the United States with a correlation coefficient (R) of 0.586 and weighted average of 2.2%, a difference of 13.3%.
Vision Disability Correlation Summary
| Measurement | Mexican | Immigrants from Uruguay |
| Minimum | 1.8% | 1.4% |
| Maximum | 5.3% | 4.2% |
| Range | 3.5% | 2.8% |
| Mean | 2.7% | 2.4% |
| Median | 2.5% | 2.1% |
| Interquartile 25% (IQ1) | 2.3% | 2.0% |
| Interquartile 75% (IQ3) | 2.9% | 2.8% |
| Interquartile Range (IQR) | 0.62% | 0.89% |
| Standard Deviation (Sample) | 0.52% | 0.72% |
| Standard Deviation (Population) | 0.52% | 0.69% |
Similar Demographics by Vision Disability
Demographics Similar to Mexicans by Vision Disability
In terms of vision disability, the demographic groups most similar to Mexicans are Cree (2.5%, a difference of 0.040%), Immigrants from Dominica (2.5%, a difference of 0.14%), African (2.5%, a difference of 0.24%), Menominee (2.5%, a difference of 0.41%), and Immigrants from Mexico (2.5%, a difference of 0.82%).
| Demographics | Rating | Rank | Vision Disability |
| Immigrants | Honduras | 0.0 /100 | #291 | Tragic 2.5% |
| Crow | 0.0 /100 | #292 | Tragic 2.5% |
| Yaqui | 0.0 /100 | #293 | Tragic 2.5% |
| Ottawa | 0.0 /100 | #294 | Tragic 2.5% |
| Delaware | 0.0 /100 | #295 | Tragic 2.5% |
| Immigrants | Mexico | 0.0 /100 | #296 | Tragic 2.5% |
| Immigrants | Dominica | 0.0 /100 | #297 | Tragic 2.5% |
| Mexicans | 0.0 /100 | #298 | Tragic 2.5% |
| Cree | 0.0 /100 | #299 | Tragic 2.5% |
| Africans | 0.0 /100 | #300 | Tragic 2.5% |
| Menominee | 0.0 /100 | #301 | Tragic 2.5% |
| Spanish American Indians | 0.0 /100 | #302 | Tragic 2.6% |
| Immigrants | Cabo Verde | 0.0 /100 | #303 | Tragic 2.6% |
| Aleuts | 0.0 /100 | #304 | Tragic 2.6% |
| Hispanics or Latinos | 0.0 /100 | #305 | Tragic 2.6% |
Demographics Similar to Immigrants from Uruguay by Vision Disability
In terms of vision disability, the demographic groups most similar to Immigrants from Uruguay are Immigrants from Brazil (2.2%, a difference of 0.23%), Immigrants from Nigeria (2.2%, a difference of 0.27%), German (2.2%, a difference of 0.27%), Indonesian (2.2%, a difference of 0.34%), and Pennsylvania German (2.2%, a difference of 0.41%).
| Demographics | Rating | Rank | Vision Disability |
| Dutch | 17.1 /100 | #203 | Poor 2.2% |
| Immigrants | Guyana | 15.9 /100 | #204 | Poor 2.2% |
| Samoans | 15.7 /100 | #205 | Poor 2.2% |
| Pennsylvania Germans | 14.5 /100 | #206 | Poor 2.2% |
| Immigrants | Nigeria | 13.5 /100 | #207 | Poor 2.2% |
| Germans | 13.4 /100 | #208 | Poor 2.2% |
| Immigrants | Brazil | 13.1 /100 | #209 | Poor 2.2% |
| Immigrants | Uruguay | 11.5 /100 | #210 | Poor 2.2% |
| Indonesians | 9.5 /100 | #211 | Tragic 2.2% |
| Bermudans | 9.0 /100 | #212 | Tragic 2.2% |
| Immigrants | Ghana | 8.9 /100 | #213 | Tragic 2.2% |
| Trinidadians and Tobagonians | 8.2 /100 | #214 | Tragic 2.2% |
| Nigerians | 7.2 /100 | #215 | Tragic 2.3% |
| Immigrants | Trinidad and Tobago | 6.1 /100 | #216 | Tragic 2.3% |
| Barbadians | 5.1 /100 | #217 | Tragic 2.3% |