Mexican vs Malaysian Single Female Poverty
COMPARE
Mexican
Malaysian
Single Female Poverty
Single Female Poverty Comparison
Mexicans
Malaysians
25.0%
SINGLE FEMALE POVERTY
0.0/ 100
METRIC RATING
299th/ 347
METRIC RANK
22.2%
SINGLE FEMALE POVERTY
2.8/ 100
METRIC RATING
239th/ 347
METRIC RANK
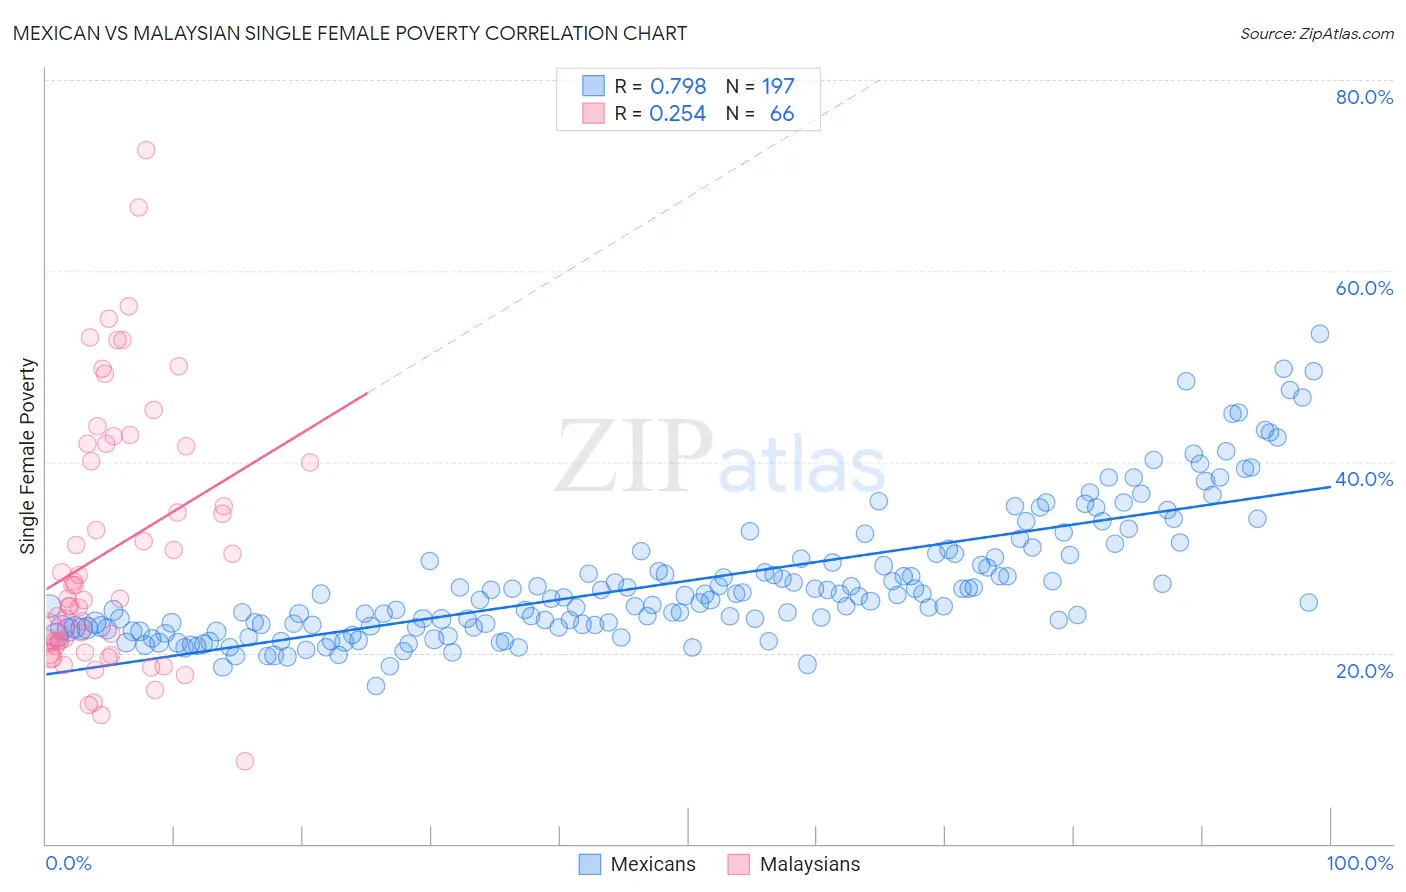
Mexican vs Malaysian Single Female Poverty Correlation Chart
The statistical analysis conducted on geographies consisting of 547,731,472 people shows a strong positive correlation between the proportion of Mexicans and poverty level among single females in the United States with a correlation coefficient (R) of 0.798 and weighted average of 25.0%. Similarly, the statistical analysis conducted on geographies consisting of 224,481,570 people shows a weak positive correlation between the proportion of Malaysians and poverty level among single females in the United States with a correlation coefficient (R) of 0.254 and weighted average of 22.2%, a difference of 12.9%.
Single Female Poverty Correlation Summary
| Measurement | Mexican | Malaysian |
| Minimum | 16.6% | 8.7% |
| Maximum | 53.5% | 72.7% |
| Range | 36.9% | 64.0% |
| Mean | 27.4% | 30.8% |
| Median | 25.5% | 25.6% |
| Interquartile 25% (IQ1) | 22.6% | 20.8% |
| Interquartile 75% (IQ3) | 30.1% | 41.7% |
| Interquartile Range (IQR) | 7.5% | 20.9% |
| Standard Deviation (Sample) | 7.0% | 13.7% |
| Standard Deviation (Population) | 7.0% | 13.6% |
Similar Demographics by Single Female Poverty
Demographics Similar to Mexicans by Single Female Poverty
In terms of single female poverty, the demographic groups most similar to Mexicans are Blackfeet (25.1%, a difference of 0.080%), Honduran (25.1%, a difference of 0.25%), Shoshone (25.1%, a difference of 0.34%), Yaqui (24.9%, a difference of 0.67%), and Somali (25.2%, a difference of 0.74%).
| Demographics | Rating | Rank | Single Female Poverty |
| Alsatians | 0.0 /100 | #292 | Tragic 24.5% |
| Americans | 0.0 /100 | #293 | Tragic 24.5% |
| French American Indians | 0.0 /100 | #294 | Tragic 24.6% |
| Hispanics or Latinos | 0.0 /100 | #295 | Tragic 24.6% |
| Africans | 0.0 /100 | #296 | Tragic 24.8% |
| Immigrants | Central America | 0.0 /100 | #297 | Tragic 24.8% |
| Yaqui | 0.0 /100 | #298 | Tragic 24.9% |
| Mexicans | 0.0 /100 | #299 | Tragic 25.0% |
| Blackfeet | 0.0 /100 | #300 | Tragic 25.1% |
| Hondurans | 0.0 /100 | #301 | Tragic 25.1% |
| Shoshone | 0.0 /100 | #302 | Tragic 25.1% |
| Somalis | 0.0 /100 | #303 | Tragic 25.2% |
| Immigrants | Congo | 0.0 /100 | #304 | Tragic 25.3% |
| Immigrants | Dominican Republic | 0.0 /100 | #305 | Tragic 25.3% |
| Immigrants | Mexico | 0.0 /100 | #306 | Tragic 25.3% |
Demographics Similar to Malaysians by Single Female Poverty
In terms of single female poverty, the demographic groups most similar to Malaysians are French Canadian (22.2%, a difference of 0.0%), French (22.2%, a difference of 0.26%), Cape Verdean (22.3%, a difference of 0.40%), Bermudan (22.3%, a difference of 0.48%), and Vietnamese (22.0%, a difference of 0.56%).
| Demographics | Rating | Rank | Single Female Poverty |
| Immigrants | Thailand | 5.0 /100 | #232 | Tragic 22.0% |
| Spaniards | 4.7 /100 | #233 | Tragic 22.0% |
| Spanish | 4.7 /100 | #234 | Tragic 22.0% |
| Dutch | 4.6 /100 | #235 | Tragic 22.0% |
| Immigrants | Ecuador | 4.2 /100 | #236 | Tragic 22.0% |
| Vietnamese | 4.0 /100 | #237 | Tragic 22.0% |
| French Canadians | 2.8 /100 | #238 | Tragic 22.2% |
| Malaysians | 2.8 /100 | #239 | Tragic 22.2% |
| French | 2.3 /100 | #240 | Tragic 22.2% |
| Cape Verdeans | 2.1 /100 | #241 | Tragic 22.3% |
| Bermudans | 2.0 /100 | #242 | Tragic 22.3% |
| West Indians | 1.9 /100 | #243 | Tragic 22.3% |
| Immigrants | Middle Africa | 1.9 /100 | #244 | Tragic 22.3% |
| Immigrants | Bangladesh | 1.8 /100 | #245 | Tragic 22.3% |
| Liberians | 1.4 /100 | #246 | Tragic 22.4% |