Menominee vs Belizean Unemployment Among Women with Children Ages 6 to 17 years
COMPARE
Menominee
Belizean
Unemployment Among Women with Children Ages 6 to 17 years
Unemployment Among Women with Children Ages 6 to 17 years Comparison
Menominee
Belizeans
9.0%
UNEMPLOYMENT AMONG WOMEN WITH CHILDREN AGES 6 TO 17 YEARS
39.3/ 100
METRIC RATING
178th/ 347
METRIC RANK
9.1%
UNEMPLOYMENT AMONG WOMEN WITH CHILDREN AGES 6 TO 17 YEARS
28.4/ 100
METRIC RATING
191st/ 347
METRIC RANK
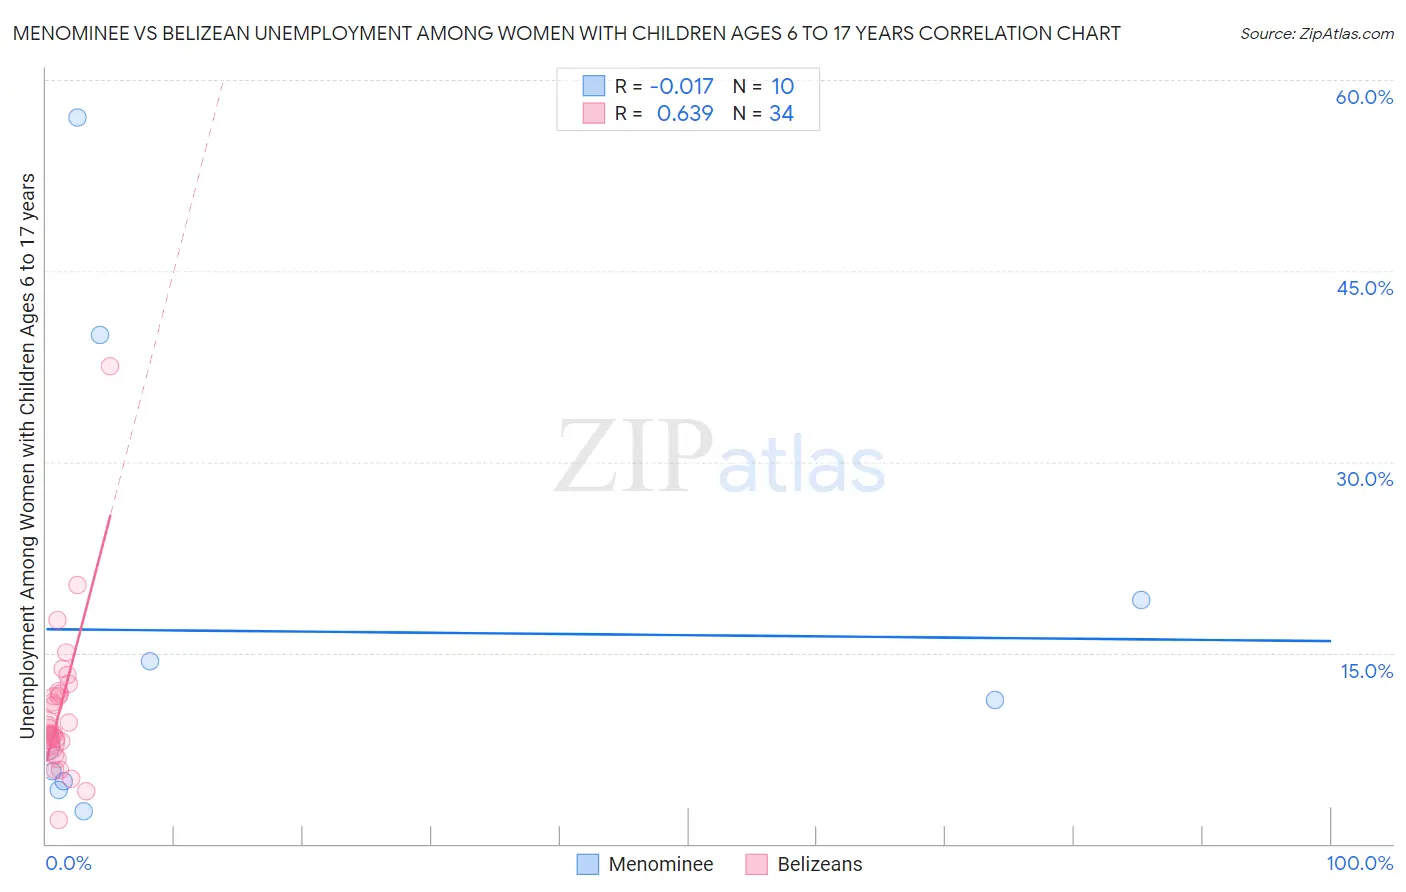
Menominee vs Belizean Unemployment Among Women with Children Ages 6 to 17 years Correlation Chart
The statistical analysis conducted on geographies consisting of 40,123,903 people shows no correlation between the proportion of Menominee and unemployment rate among women with children between the ages 6 and 17 in the United States with a correlation coefficient (R) of -0.017 and weighted average of 9.0%. Similarly, the statistical analysis conducted on geographies consisting of 125,536,739 people shows a significant positive correlation between the proportion of Belizeans and unemployment rate among women with children between the ages 6 and 17 in the United States with a correlation coefficient (R) of 0.639 and weighted average of 9.1%, a difference of 0.54%.
Unemployment Among Women with Children Ages 6 to 17 years Correlation Summary
| Measurement | Menominee | Belizean |
| Minimum | 2.6% | 1.8% |
| Maximum | 57.1% | 37.5% |
| Range | 54.5% | 35.7% |
| Mean | 16.7% | 10.4% |
| Median | 9.5% | 8.9% |
| Interquartile 25% (IQ1) | 4.9% | 8.0% |
| Interquartile 75% (IQ3) | 19.1% | 11.8% |
| Interquartile Range (IQR) | 14.2% | 3.8% |
| Standard Deviation (Sample) | 18.0% | 6.0% |
| Standard Deviation (Population) | 17.1% | 5.9% |
Demographics Similar to Menominee and Belizeans by Unemployment Among Women with Children Ages 6 to 17 years
In terms of unemployment among women with children ages 6 to 17 years, the demographic groups most similar to Menominee are Immigrants from Zaire (9.0%, a difference of 0.040%), Ethiopian (9.0%, a difference of 0.080%), Immigrants from Jordan (9.0%, a difference of 0.11%), Immigrants from Italy (9.0%, a difference of 0.20%), and Immigrants from Czechoslovakia (9.0%, a difference of 0.23%). Similarly, the demographic groups most similar to Belizeans are Slovene (9.1%, a difference of 0.0%), Immigrants (9.1%, a difference of 0.040%), Immigrants from Syria (9.1%, a difference of 0.070%), Guamanian/Chamorro (9.1%, a difference of 0.070%), and Comanche (9.0%, a difference of 0.080%).
| Demographics | Rating | Rank | Unemployment Among Women with Children Ages 6 to 17 years |
| Immigrants | Costa Rica | 50.0 /100 | #174 | Average 9.0% |
| Immigrants | Sierra Leone | 45.9 /100 | #175 | Average 9.0% |
| Immigrants | Italy | 43.7 /100 | #176 | Average 9.0% |
| Immigrants | Jordan | 41.6 /100 | #177 | Average 9.0% |
| Menominee | 39.3 /100 | #178 | Fair 9.0% |
| Immigrants | Zaire | 38.3 /100 | #179 | Fair 9.0% |
| Ethiopians | 37.6 /100 | #180 | Fair 9.0% |
| Immigrants | Czechoslovakia | 34.5 /100 | #181 | Fair 9.0% |
| South American Indians | 34.4 /100 | #182 | Fair 9.0% |
| Swiss | 33.5 /100 | #183 | Fair 9.0% |
| Palestinians | 33.4 /100 | #184 | Fair 9.0% |
| Immigrants | Congo | 32.5 /100 | #185 | Fair 9.0% |
| Immigrants | Spain | 32.4 /100 | #186 | Fair 9.0% |
| Comanche | 30.0 /100 | #187 | Fair 9.0% |
| Immigrants | Syria | 29.7 /100 | #188 | Fair 9.1% |
| Immigrants | Immigrants | 29.2 /100 | #189 | Fair 9.1% |
| Slovenes | 28.5 /100 | #190 | Fair 9.1% |
| Belizeans | 28.4 /100 | #191 | Fair 9.1% |
| Guamanians/Chamorros | 27.2 /100 | #192 | Fair 9.1% |
| Immigrants | Turkey | 25.8 /100 | #193 | Fair 9.1% |
| Immigrants | Kazakhstan | 25.3 /100 | #194 | Fair 9.1% |