Menominee vs African Child Poverty Among Girls Under 16
COMPARE
Menominee
African
Child Poverty Among Girls Under 16
Child Poverty Among Girls Under 16 Comparison
Menominee
Africans
25.0%
CHILD POVERTY AMONG GIRLS UNDER 16
0.0/ 100
METRIC RATING
334th/ 347
METRIC RANK
21.9%
CHILD POVERTY AMONG GIRLS UNDER 16
0.0/ 100
METRIC RATING
317th/ 347
METRIC RANK
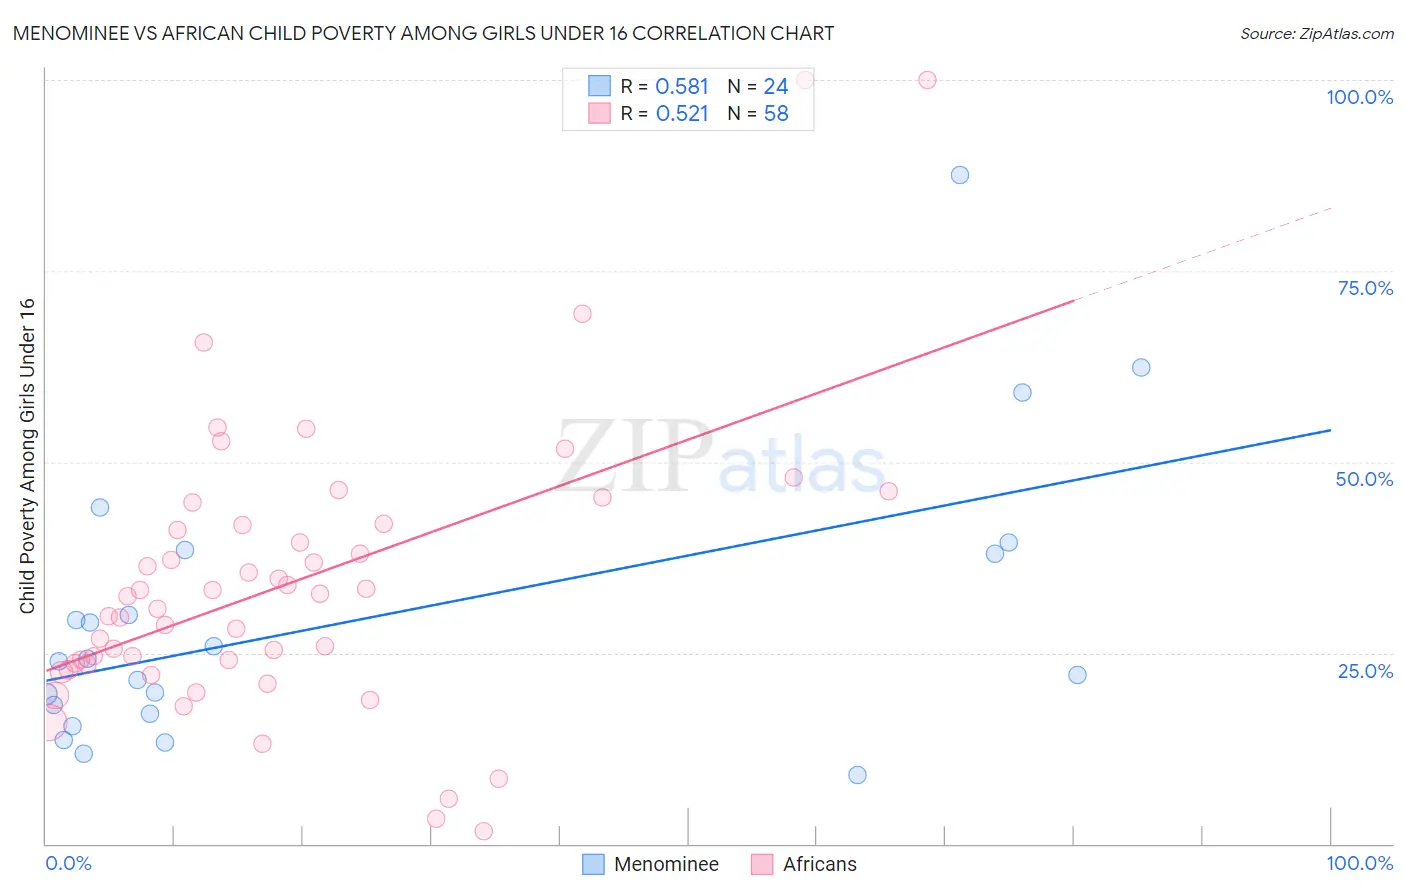
Menominee vs African Child Poverty Among Girls Under 16 Correlation Chart
The statistical analysis conducted on geographies consisting of 45,532,886 people shows a substantial positive correlation between the proportion of Menominee and poverty level among girls under the age of 16 in the United States with a correlation coefficient (R) of 0.581 and weighted average of 25.0%. Similarly, the statistical analysis conducted on geographies consisting of 462,760,233 people shows a substantial positive correlation between the proportion of Africans and poverty level among girls under the age of 16 in the United States with a correlation coefficient (R) of 0.521 and weighted average of 21.9%, a difference of 14.1%.
Child Poverty Among Girls Under 16 Correlation Summary
| Measurement | Menominee | African |
| Minimum | 9.0% | 1.7% |
| Maximum | 87.5% | 100.0% |
| Range | 78.5% | 98.3% |
| Mean | 29.7% | 33.9% |
| Median | 24.1% | 31.6% |
| Interquartile 25% (IQ1) | 17.6% | 23.5% |
| Interquartile 75% (IQ3) | 38.2% | 41.7% |
| Interquartile Range (IQR) | 20.6% | 18.2% |
| Standard Deviation (Sample) | 18.5% | 18.8% |
| Standard Deviation (Population) | 18.1% | 18.6% |
Demographics Similar to Menominee and Africans by Child Poverty Among Girls Under 16
In terms of child poverty among girls under 16, the demographic groups most similar to Menominee are Pueblo (25.2%, a difference of 0.70%), Black/African American (24.7%, a difference of 1.5%), Native/Alaskan (24.0%, a difference of 4.1%), Apache (23.8%, a difference of 5.0%), and Immigrants from Dominican Republic (23.8%, a difference of 5.1%). Similarly, the demographic groups most similar to Africans are Immigrants from Guatemala (21.9%, a difference of 0.32%), Ute (21.8%, a difference of 0.59%), Immigrants from Dominica (22.1%, a difference of 0.66%), U.S. Virgin Islander (22.1%, a difference of 0.82%), and Honduran (22.2%, a difference of 1.4%).
| Demographics | Rating | Rank | Child Poverty Among Girls Under 16 |
| Ute | 0.0 /100 | #315 | Tragic 21.8% |
| Immigrants | Guatemala | 0.0 /100 | #316 | Tragic 21.9% |
| Africans | 0.0 /100 | #317 | Tragic 21.9% |
| Immigrants | Dominica | 0.0 /100 | #318 | Tragic 22.1% |
| U.S. Virgin Islanders | 0.0 /100 | #319 | Tragic 22.1% |
| Hondurans | 0.0 /100 | #320 | Tragic 22.2% |
| Colville | 0.0 /100 | #321 | Tragic 22.5% |
| Yakama | 0.0 /100 | #322 | Tragic 22.6% |
| Cajuns | 0.0 /100 | #323 | Tragic 22.6% |
| Paiute | 0.0 /100 | #324 | Tragic 22.6% |
| Immigrants | Congo | 0.0 /100 | #325 | Tragic 22.7% |
| Immigrants | Honduras | 0.0 /100 | #326 | Tragic 22.8% |
| Central American Indians | 0.0 /100 | #327 | Tragic 22.8% |
| Dominicans | 0.0 /100 | #328 | Tragic 23.7% |
| Kiowa | 0.0 /100 | #329 | Tragic 23.7% |
| Immigrants | Dominican Republic | 0.0 /100 | #330 | Tragic 23.8% |
| Apache | 0.0 /100 | #331 | Tragic 23.8% |
| Natives/Alaskans | 0.0 /100 | #332 | Tragic 24.0% |
| Blacks/African Americans | 0.0 /100 | #333 | Tragic 24.7% |
| Menominee | 0.0 /100 | #334 | Tragic 25.0% |
| Pueblo | 0.0 /100 | #335 | Tragic 25.2% |