Alaska Native vs African Single Female Poverty
COMPARE
Alaska Native
African
Single Female Poverty
Single Female Poverty Comparison
Alaska Natives
Africans
23.3%
SINGLE FEMALE POVERTY
0.1/ 100
METRIC RATING
273rd/ 347
METRIC RANK
24.8%
SINGLE FEMALE POVERTY
0.0/ 100
METRIC RATING
296th/ 347
METRIC RANK
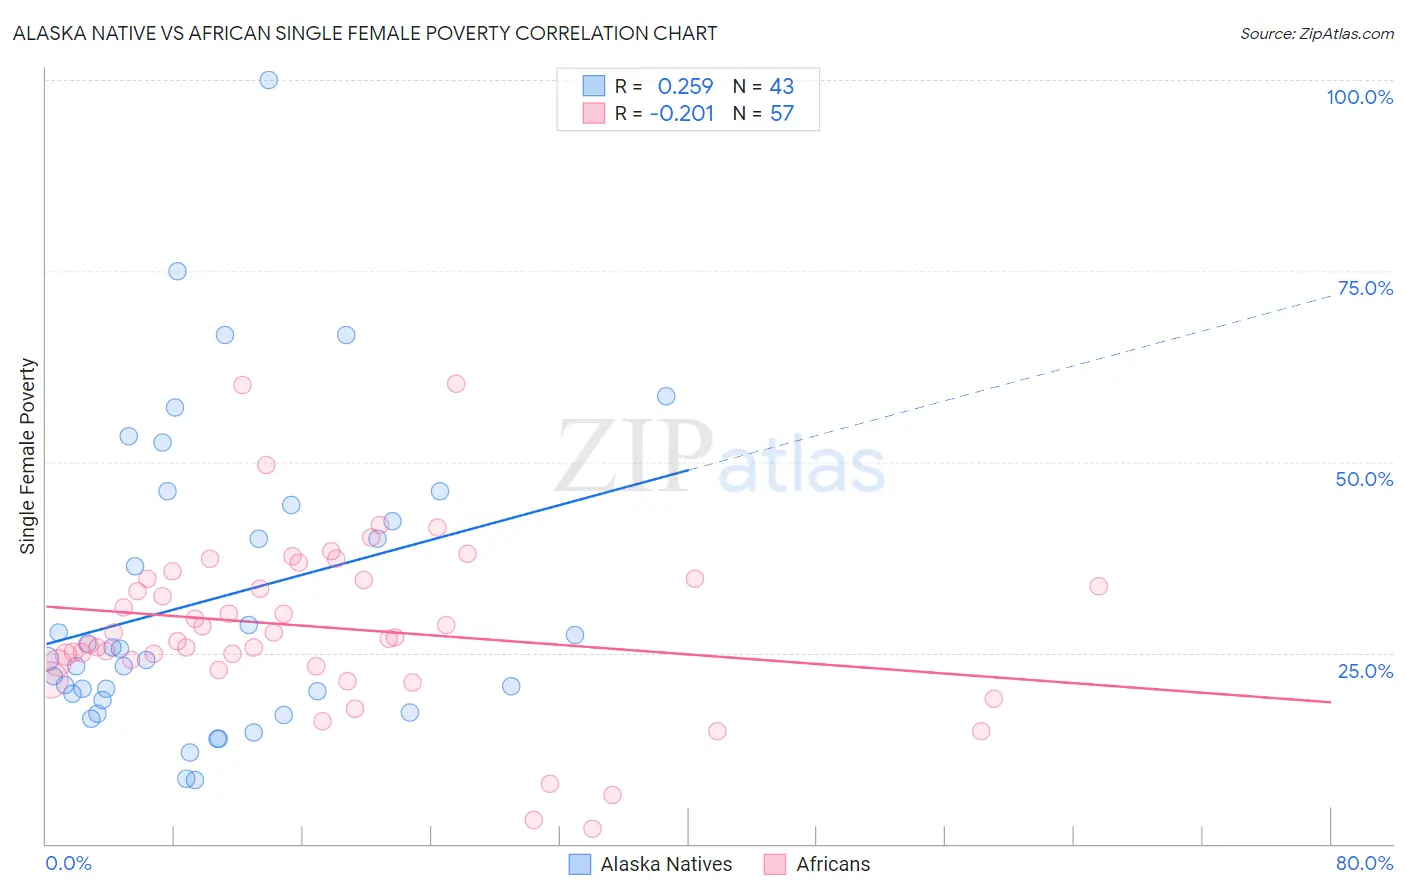
Alaska Native vs African Single Female Poverty Correlation Chart
The statistical analysis conducted on geographies consisting of 76,522,237 people shows a weak positive correlation between the proportion of Alaska Natives and poverty level among single females in the United States with a correlation coefficient (R) of 0.259 and weighted average of 23.3%. Similarly, the statistical analysis conducted on geographies consisting of 463,525,497 people shows a weak negative correlation between the proportion of Africans and poverty level among single females in the United States with a correlation coefficient (R) of -0.201 and weighted average of 24.8%, a difference of 6.3%.
Single Female Poverty Correlation Summary
| Measurement | Alaska Native | African |
| Minimum | 8.3% | 1.9% |
| Maximum | 100.0% | 60.3% |
| Range | 91.7% | 58.4% |
| Mean | 32.1% | 28.3% |
| Median | 24.2% | 27.0% |
| Interquartile 25% (IQ1) | 18.8% | 23.4% |
| Interquartile 75% (IQ3) | 44.4% | 34.6% |
| Interquartile Range (IQR) | 25.6% | 11.2% |
| Standard Deviation (Sample) | 20.0% | 11.2% |
| Standard Deviation (Population) | 19.8% | 11.1% |
Similar Demographics by Single Female Poverty
Demographics Similar to Alaska Natives by Single Female Poverty
In terms of single female poverty, the demographic groups most similar to Alaska Natives are Marshallese (23.3%, a difference of 0.010%), Immigrants from Senegal (23.2%, a difference of 0.25%), Mexican American Indian (23.4%, a difference of 0.27%), Subsaharan African (23.2%, a difference of 0.44%), and Inupiat (23.1%, a difference of 0.69%).
| Demographics | Rating | Rank | Single Female Poverty |
| Immigrants | Micronesia | 0.2 /100 | #266 | Tragic 23.0% |
| Senegalese | 0.2 /100 | #267 | Tragic 23.0% |
| Fijians | 0.2 /100 | #268 | Tragic 23.1% |
| Hmong | 0.2 /100 | #269 | Tragic 23.1% |
| Inupiat | 0.2 /100 | #270 | Tragic 23.1% |
| Sub-Saharan Africans | 0.1 /100 | #271 | Tragic 23.2% |
| Immigrants | Senegal | 0.1 /100 | #272 | Tragic 23.2% |
| Alaska Natives | 0.1 /100 | #273 | Tragic 23.3% |
| Marshallese | 0.1 /100 | #274 | Tragic 23.3% |
| Mexican American Indians | 0.1 /100 | #275 | Tragic 23.4% |
| Immigrants | Azores | 0.0 /100 | #276 | Tragic 23.5% |
| Pennsylvania Germans | 0.0 /100 | #277 | Tragic 23.6% |
| Immigrants | Nonimmigrants | 0.0 /100 | #278 | Tragic 23.6% |
| Alaskan Athabascans | 0.0 /100 | #279 | Tragic 23.6% |
| Immigrants | Latin America | 0.0 /100 | #280 | Tragic 23.7% |
Demographics Similar to Africans by Single Female Poverty
In terms of single female poverty, the demographic groups most similar to Africans are Immigrants from Central America (24.8%, a difference of 0.28%), Hispanic or Latino (24.6%, a difference of 0.48%), Yaqui (24.9%, a difference of 0.48%), French American Indian (24.6%, a difference of 0.83%), and American (24.5%, a difference of 0.98%).
| Demographics | Rating | Rank | Single Female Poverty |
| U.S. Virgin Islanders | 0.0 /100 | #289 | Tragic 24.2% |
| Indonesians | 0.0 /100 | #290 | Tragic 24.3% |
| Osage | 0.0 /100 | #291 | Tragic 24.4% |
| Alsatians | 0.0 /100 | #292 | Tragic 24.5% |
| Americans | 0.0 /100 | #293 | Tragic 24.5% |
| French American Indians | 0.0 /100 | #294 | Tragic 24.6% |
| Hispanics or Latinos | 0.0 /100 | #295 | Tragic 24.6% |
| Africans | 0.0 /100 | #296 | Tragic 24.8% |
| Immigrants | Central America | 0.0 /100 | #297 | Tragic 24.8% |
| Yaqui | 0.0 /100 | #298 | Tragic 24.9% |
| Mexicans | 0.0 /100 | #299 | Tragic 25.0% |
| Blackfeet | 0.0 /100 | #300 | Tragic 25.1% |
| Hondurans | 0.0 /100 | #301 | Tragic 25.1% |
| Shoshone | 0.0 /100 | #302 | Tragic 25.1% |
| Somalis | 0.0 /100 | #303 | Tragic 25.2% |