Malaysian vs Ute Married-Couple Family Poverty
COMPARE
Malaysian
Ute
Married-Couple Family Poverty
Married-Couple Family Poverty Comparison
Malaysians
Ute
5.4%
MARRIED-COUPLE FAMILY POVERTY
29.5/ 100
METRIC RATING
193rd/ 347
METRIC RANK
6.4%
MARRIED-COUPLE FAMILY POVERTY
0.0/ 100
METRIC RATING
283rd/ 347
METRIC RANK
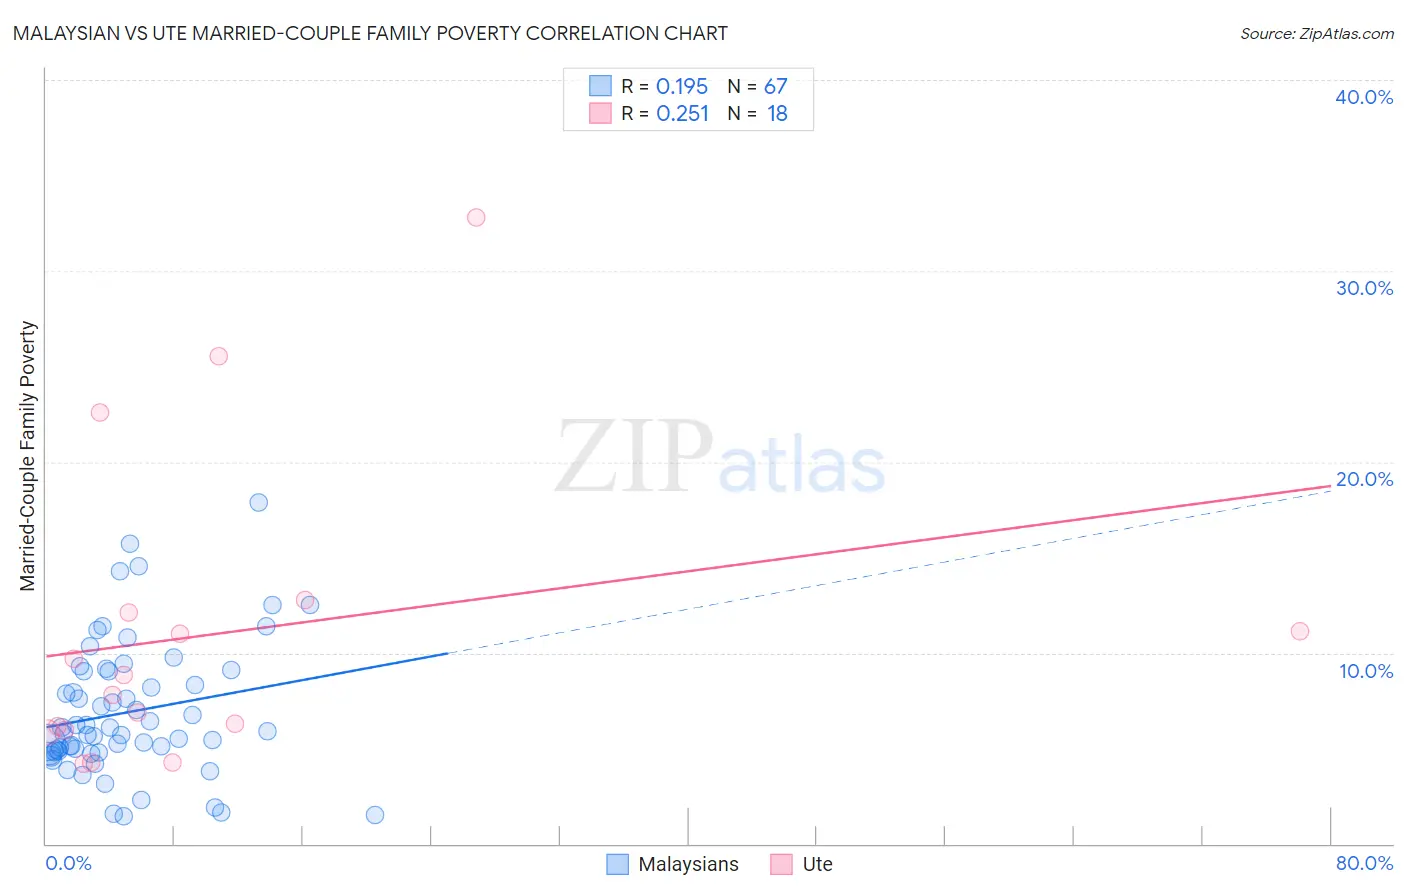
Malaysian vs Ute Married-Couple Family Poverty Correlation Chart
The statistical analysis conducted on geographies consisting of 224,983,530 people shows a poor positive correlation between the proportion of Malaysians and poverty level among married-couple families in the United States with a correlation coefficient (R) of 0.195 and weighted average of 5.4%. Similarly, the statistical analysis conducted on geographies consisting of 55,601,048 people shows a weak positive correlation between the proportion of Ute and poverty level among married-couple families in the United States with a correlation coefficient (R) of 0.251 and weighted average of 6.4%, a difference of 20.3%.
Married-Couple Family Poverty Correlation Summary
| Measurement | Malaysian | Ute |
| Minimum | 1.5% | 4.2% |
| Maximum | 17.9% | 32.8% |
| Range | 16.4% | 28.6% |
| Mean | 6.9% | 11.0% |
| Median | 5.9% | 8.3% |
| Interquartile 25% (IQ1) | 4.8% | 6.0% |
| Interquartile 75% (IQ3) | 9.1% | 12.1% |
| Interquartile Range (IQR) | 4.2% | 6.1% |
| Standard Deviation (Sample) | 3.5% | 8.0% |
| Standard Deviation (Population) | 3.4% | 7.8% |
Similar Demographics by Married-Couple Family Poverty
Demographics Similar to Malaysians by Married-Couple Family Poverty
In terms of married-couple family poverty, the demographic groups most similar to Malaysians are Cape Verdean (5.3%, a difference of 0.17%), Immigrants from Cabo Verde (5.3%, a difference of 0.19%), Immigrants from Israel (5.4%, a difference of 0.22%), Immigrants from the Azores (5.4%, a difference of 0.27%), and Ugandan (5.3%, a difference of 0.29%).
| Demographics | Rating | Rank | Married-Couple Family Poverty |
| Hungarians | 34.7 /100 | #186 | Fair 5.3% |
| Immigrants | Albania | 33.8 /100 | #187 | Fair 5.3% |
| Israelis | 33.1 /100 | #188 | Fair 5.3% |
| South American Indians | 32.5 /100 | #189 | Fair 5.3% |
| Ugandans | 31.6 /100 | #190 | Fair 5.3% |
| Immigrants | Cabo Verde | 30.9 /100 | #191 | Fair 5.3% |
| Cape Verdeans | 30.7 /100 | #192 | Fair 5.3% |
| Malaysians | 29.5 /100 | #193 | Fair 5.4% |
| Immigrants | Israel | 27.8 /100 | #194 | Fair 5.4% |
| Immigrants | Azores | 27.5 /100 | #195 | Fair 5.4% |
| Spaniards | 27.4 /100 | #196 | Fair 5.4% |
| Liberians | 26.3 /100 | #197 | Fair 5.4% |
| Immigrants | Belarus | 26.2 /100 | #198 | Fair 5.4% |
| Uruguayans | 25.0 /100 | #199 | Fair 5.4% |
| Immigrants | Morocco | 24.3 /100 | #200 | Fair 5.4% |
Demographics Similar to Ute by Married-Couple Family Poverty
In terms of married-couple family poverty, the demographic groups most similar to Ute are Dutch West Indian (6.4%, a difference of 0.12%), Seminole (6.4%, a difference of 0.38%), Mexican American Indian (6.4%, a difference of 0.39%), Black/African American (6.5%, a difference of 0.63%), and Guyanese (6.5%, a difference of 0.73%).
| Demographics | Rating | Rank | Married-Couple Family Poverty |
| Yaqui | 0.1 /100 | #276 | Tragic 6.3% |
| Indonesians | 0.1 /100 | #277 | Tragic 6.3% |
| Immigrants | Trinidad and Tobago | 0.1 /100 | #278 | Tragic 6.4% |
| Houma | 0.0 /100 | #279 | Tragic 6.4% |
| West Indians | 0.0 /100 | #280 | Tragic 6.4% |
| Mexican American Indians | 0.0 /100 | #281 | Tragic 6.4% |
| Seminole | 0.0 /100 | #282 | Tragic 6.4% |
| Ute | 0.0 /100 | #283 | Tragic 6.4% |
| Dutch West Indians | 0.0 /100 | #284 | Tragic 6.4% |
| Blacks/African Americans | 0.0 /100 | #285 | Tragic 6.5% |
| Guyanese | 0.0 /100 | #286 | Tragic 6.5% |
| Ecuadorians | 0.0 /100 | #287 | Tragic 6.5% |
| Salvadorans | 0.0 /100 | #288 | Tragic 6.5% |
| Nepalese | 0.0 /100 | #289 | Tragic 6.5% |
| Immigrants | Barbados | 0.0 /100 | #290 | Tragic 6.5% |