Luxembourger vs Immigrants from Micronesia 1st Grade
COMPARE
Luxembourger
Immigrants from Micronesia
1st Grade
1st Grade Comparison
Luxembourgers
Immigrants from Micronesia
98.5%
1ST GRADE
99.9/ 100
METRIC RATING
40th/ 347
METRIC RANK
97.9%
1ST GRADE
55.3/ 100
METRIC RATING
169th/ 347
METRIC RANK
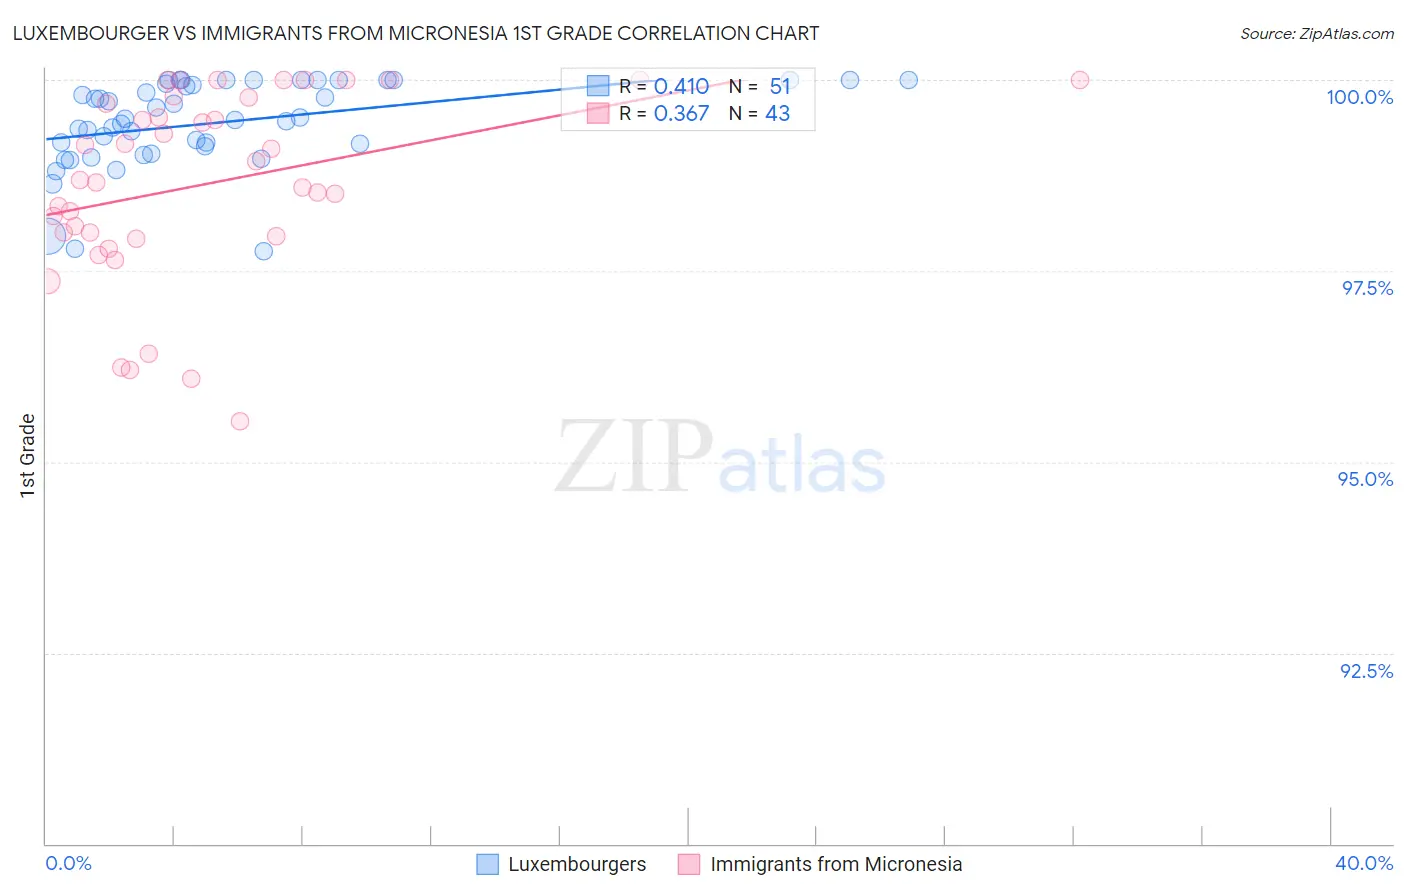
Luxembourger vs Immigrants from Micronesia 1st Grade Correlation Chart
The statistical analysis conducted on geographies consisting of 144,675,804 people shows a moderate positive correlation between the proportion of Luxembourgers and percentage of population with at least 1st grade education in the United States with a correlation coefficient (R) of 0.410 and weighted average of 98.5%. Similarly, the statistical analysis conducted on geographies consisting of 61,604,657 people shows a mild positive correlation between the proportion of Immigrants from Micronesia and percentage of population with at least 1st grade education in the United States with a correlation coefficient (R) of 0.367 and weighted average of 97.9%, a difference of 0.54%.
1st Grade Correlation Summary
| Measurement | Luxembourger | Immigrants from Micronesia |
| Minimum | 97.8% | 95.5% |
| Maximum | 100.0% | 100.0% |
| Range | 2.2% | 4.5% |
| Mean | 99.4% | 98.6% |
| Median | 99.5% | 98.7% |
| Interquartile 25% (IQ1) | 99.1% | 98.0% |
| Interquartile 75% (IQ3) | 100.0% | 99.8% |
| Interquartile Range (IQR) | 0.87% | 1.8% |
| Standard Deviation (Sample) | 0.57% | 1.2% |
| Standard Deviation (Population) | 0.57% | 1.2% |
Similar Demographics by 1st Grade
Demographics Similar to Luxembourgers by 1st Grade
In terms of 1st grade, the demographic groups most similar to Luxembourgers are Eastern European (98.5%, a difference of 0.0%), Italian (98.5%, a difference of 0.010%), Chippewa (98.5%, a difference of 0.010%), Latvian (98.5%, a difference of 0.010%), and Native Hawaiian (98.5%, a difference of 0.010%).
| Demographics | Rating | Rank | 1st Grade |
| Scandinavians | 100.0 /100 | #33 | Exceptional 98.5% |
| Swiss | 100.0 /100 | #34 | Exceptional 98.5% |
| Chinese | 100.0 /100 | #35 | Exceptional 98.5% |
| British | 100.0 /100 | #36 | Exceptional 98.5% |
| Italians | 99.9 /100 | #37 | Exceptional 98.5% |
| Chippewa | 99.9 /100 | #38 | Exceptional 98.5% |
| Latvians | 99.9 /100 | #39 | Exceptional 98.5% |
| Luxembourgers | 99.9 /100 | #40 | Exceptional 98.5% |
| Eastern Europeans | 99.9 /100 | #41 | Exceptional 98.5% |
| Native Hawaiians | 99.9 /100 | #42 | Exceptional 98.5% |
| Lumbee | 99.9 /100 | #43 | Exceptional 98.5% |
| Northern Europeans | 99.9 /100 | #44 | Exceptional 98.5% |
| Belgians | 99.9 /100 | #45 | Exceptional 98.4% |
| Hungarians | 99.9 /100 | #46 | Exceptional 98.4% |
| Ottawa | 99.8 /100 | #47 | Exceptional 98.4% |
Demographics Similar to Immigrants from Micronesia by 1st Grade
In terms of 1st grade, the demographic groups most similar to Immigrants from Micronesia are Ugandan (97.9%, a difference of 0.0%), Navajo (97.9%, a difference of 0.0%), Bermudan (97.9%, a difference of 0.0%), Chilean (97.9%, a difference of 0.0%), and Immigrants from Spain (97.9%, a difference of 0.0%).
| Demographics | Rating | Rank | 1st Grade |
| Immigrants | Eastern Europe | 58.9 /100 | #162 | Average 97.9% |
| Spanish Americans | 57.7 /100 | #163 | Average 97.9% |
| Brazilians | 57.6 /100 | #164 | Average 97.9% |
| Ugandans | 56.9 /100 | #165 | Average 97.9% |
| Navajo | 56.6 /100 | #166 | Average 97.9% |
| Bermudans | 56.3 /100 | #167 | Average 97.9% |
| Chileans | 55.6 /100 | #168 | Average 97.9% |
| Immigrants | Micronesia | 55.3 /100 | #169 | Average 97.9% |
| Immigrants | Spain | 54.9 /100 | #170 | Average 97.9% |
| Immigrants | Jordan | 53.9 /100 | #171 | Average 97.9% |
| Immigrants | Korea | 53.0 /100 | #172 | Average 97.9% |
| Kenyans | 51.2 /100 | #173 | Average 97.9% |
| Natives/Alaskans | 50.0 /100 | #174 | Average 97.9% |
| Immigrants | Sri Lanka | 49.7 /100 | #175 | Average 97.9% |
| Albanians | 49.6 /100 | #176 | Average 97.9% |