Immigrants from Latvia vs Immigrants from Micronesia Receiving Food Stamps
COMPARE
Immigrants from Latvia
Immigrants from Micronesia
Receiving Food Stamps
Receiving Food Stamps Comparison
Immigrants from Latvia
Immigrants from Micronesia
10.3%
RECEIVING FOOD STAMPS
96.8/ 100
METRIC RATING
103rd/ 347
METRIC RANK
13.5%
RECEIVING FOOD STAMPS
1.3/ 100
METRIC RATING
239th/ 347
METRIC RANK
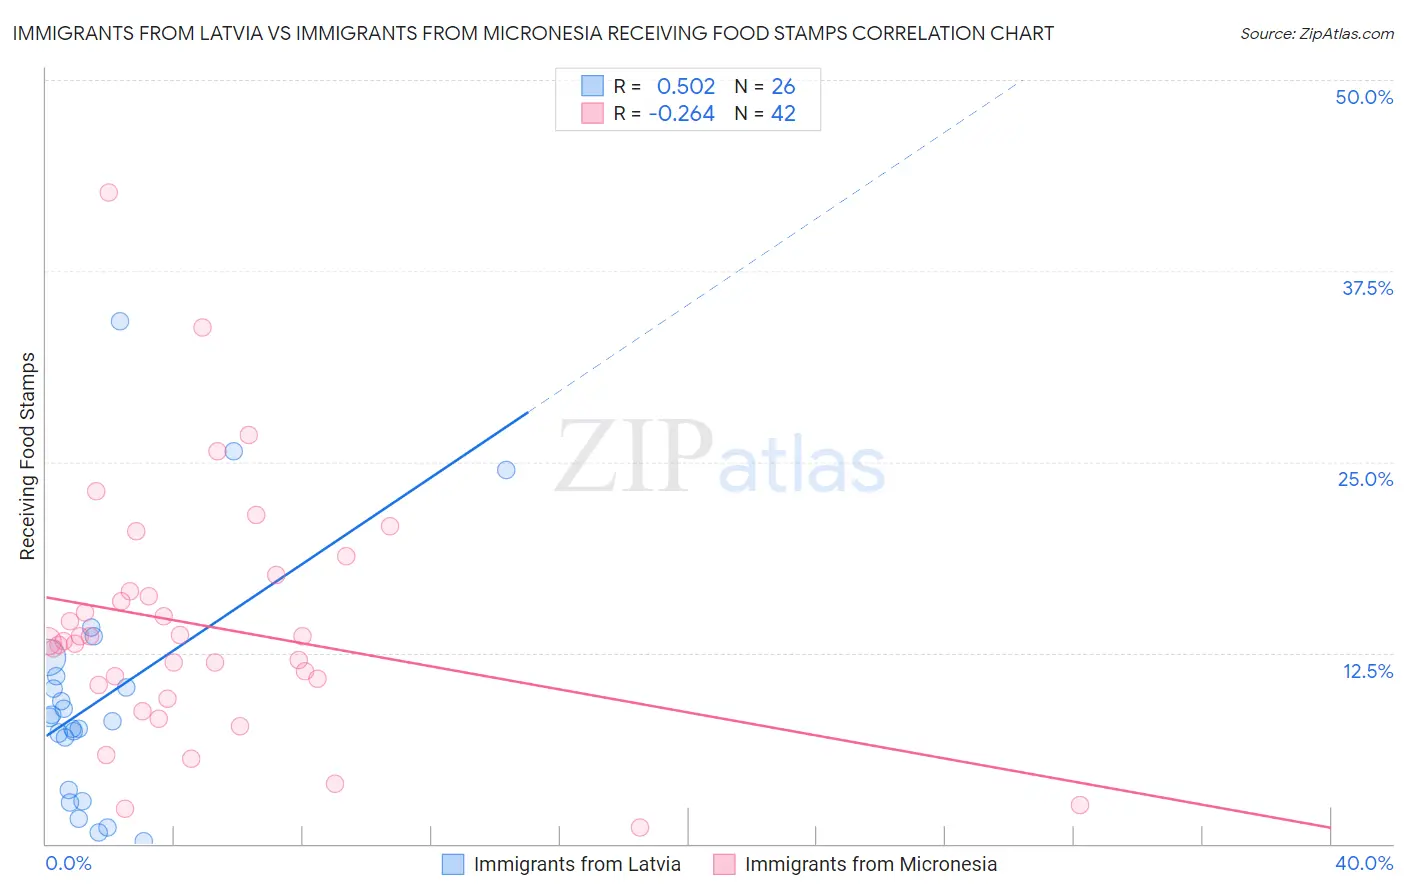
Immigrants from Latvia vs Immigrants from Micronesia Receiving Food Stamps Correlation Chart
The statistical analysis conducted on geographies consisting of 113,573,789 people shows a substantial positive correlation between the proportion of Immigrants from Latvia and percentage of population receiving government assistance and/or food stamps in the United States with a correlation coefficient (R) of 0.502 and weighted average of 10.3%. Similarly, the statistical analysis conducted on geographies consisting of 61,597,185 people shows a weak negative correlation between the proportion of Immigrants from Micronesia and percentage of population receiving government assistance and/or food stamps in the United States with a correlation coefficient (R) of -0.264 and weighted average of 13.5%, a difference of 30.6%.
Receiving Food Stamps Correlation Summary
| Measurement | Immigrants from Latvia | Immigrants from Micronesia |
| Minimum | 0.20% | 1.1% |
| Maximum | 34.2% | 42.6% |
| Range | 34.0% | 41.5% |
| Mean | 9.5% | 14.3% |
| Median | 8.1% | 13.3% |
| Interquartile 25% (IQ1) | 3.5% | 10.4% |
| Interquartile 75% (IQ3) | 11.0% | 16.5% |
| Interquartile Range (IQR) | 7.5% | 6.1% |
| Standard Deviation (Sample) | 8.0% | 8.0% |
| Standard Deviation (Population) | 7.8% | 7.9% |
Similar Demographics by Receiving Food Stamps
Demographics Similar to Immigrants from Latvia by Receiving Food Stamps
In terms of receiving food stamps, the demographic groups most similar to Immigrants from Latvia are Immigrants from Hungary (10.3%, a difference of 0.010%), Immigrants from Europe (10.3%, a difference of 0.10%), Immigrants from Western Europe (10.3%, a difference of 0.18%), Palestinian (10.3%, a difference of 0.18%), and Serbian (10.3%, a difference of 0.31%).
| Demographics | Rating | Rank | Receiving Food Stamps |
| Welsh | 97.3 /100 | #96 | Exceptional 10.3% |
| Czechoslovakians | 97.2 /100 | #97 | Exceptional 10.3% |
| Immigrants | Egypt | 97.1 /100 | #98 | Exceptional 10.3% |
| Serbians | 97.0 /100 | #99 | Exceptional 10.3% |
| Immigrants | Western Europe | 96.9 /100 | #100 | Exceptional 10.3% |
| Palestinians | 96.9 /100 | #101 | Exceptional 10.3% |
| Immigrants | Europe | 96.8 /100 | #102 | Exceptional 10.3% |
| Immigrants | Latvia | 96.8 /100 | #103 | Exceptional 10.3% |
| Immigrants | Hungary | 96.7 /100 | #104 | Exceptional 10.3% |
| Immigrants | Malaysia | 96.5 /100 | #105 | Exceptional 10.4% |
| Immigrants | Italy | 96.4 /100 | #106 | Exceptional 10.4% |
| Koreans | 96.3 /100 | #107 | Exceptional 10.4% |
| Carpatho Rusyns | 96.2 /100 | #108 | Exceptional 10.4% |
| Immigrants | Pakistan | 96.2 /100 | #109 | Exceptional 10.4% |
| Pakistanis | 95.9 /100 | #110 | Exceptional 10.4% |
Demographics Similar to Immigrants from Micronesia by Receiving Food Stamps
In terms of receiving food stamps, the demographic groups most similar to Immigrants from Micronesia are French American Indian (13.5%, a difference of 0.23%), Iroquois (13.5%, a difference of 0.30%), Immigrants from El Salvador (13.5%, a difference of 0.42%), Crow (13.4%, a difference of 0.65%), and Choctaw (13.6%, a difference of 0.73%).
| Demographics | Rating | Rank | Receiving Food Stamps |
| Salvadorans | 2.7 /100 | #232 | Tragic 13.2% |
| Cherokee | 2.5 /100 | #233 | Tragic 13.2% |
| Comanche | 2.4 /100 | #234 | Tragic 13.3% |
| Immigrants | Zaire | 1.9 /100 | #235 | Tragic 13.4% |
| Crow | 1.6 /100 | #236 | Tragic 13.4% |
| Immigrants | El Salvador | 1.5 /100 | #237 | Tragic 13.5% |
| French American Indians | 1.4 /100 | #238 | Tragic 13.5% |
| Immigrants | Micronesia | 1.3 /100 | #239 | Tragic 13.5% |
| Iroquois | 1.2 /100 | #240 | Tragic 13.5% |
| Choctaw | 1.0 /100 | #241 | Tragic 13.6% |
| Immigrants | Panama | 1.0 /100 | #242 | Tragic 13.6% |
| Somalis | 0.9 /100 | #243 | Tragic 13.7% |
| Cajuns | 0.9 /100 | #244 | Tragic 13.7% |
| Immigrants | Somalia | 0.9 /100 | #245 | Tragic 13.7% |
| Cree | 0.8 /100 | #246 | Tragic 13.7% |