Luxembourger vs Immigrants from Micronesia Child Poverty Among Girls Under 16
COMPARE
Luxembourger
Immigrants from Micronesia
Child Poverty Among Girls Under 16
Child Poverty Among Girls Under 16 Comparison
Luxembourgers
Immigrants from Micronesia
14.3%
CHILD POVERTY AMONG GIRLS UNDER 16
99.0/ 100
METRIC RATING
53rd/ 347
METRIC RANK
18.0%
CHILD POVERTY AMONG GIRLS UNDER 16
3.5/ 100
METRIC RATING
221st/ 347
METRIC RANK
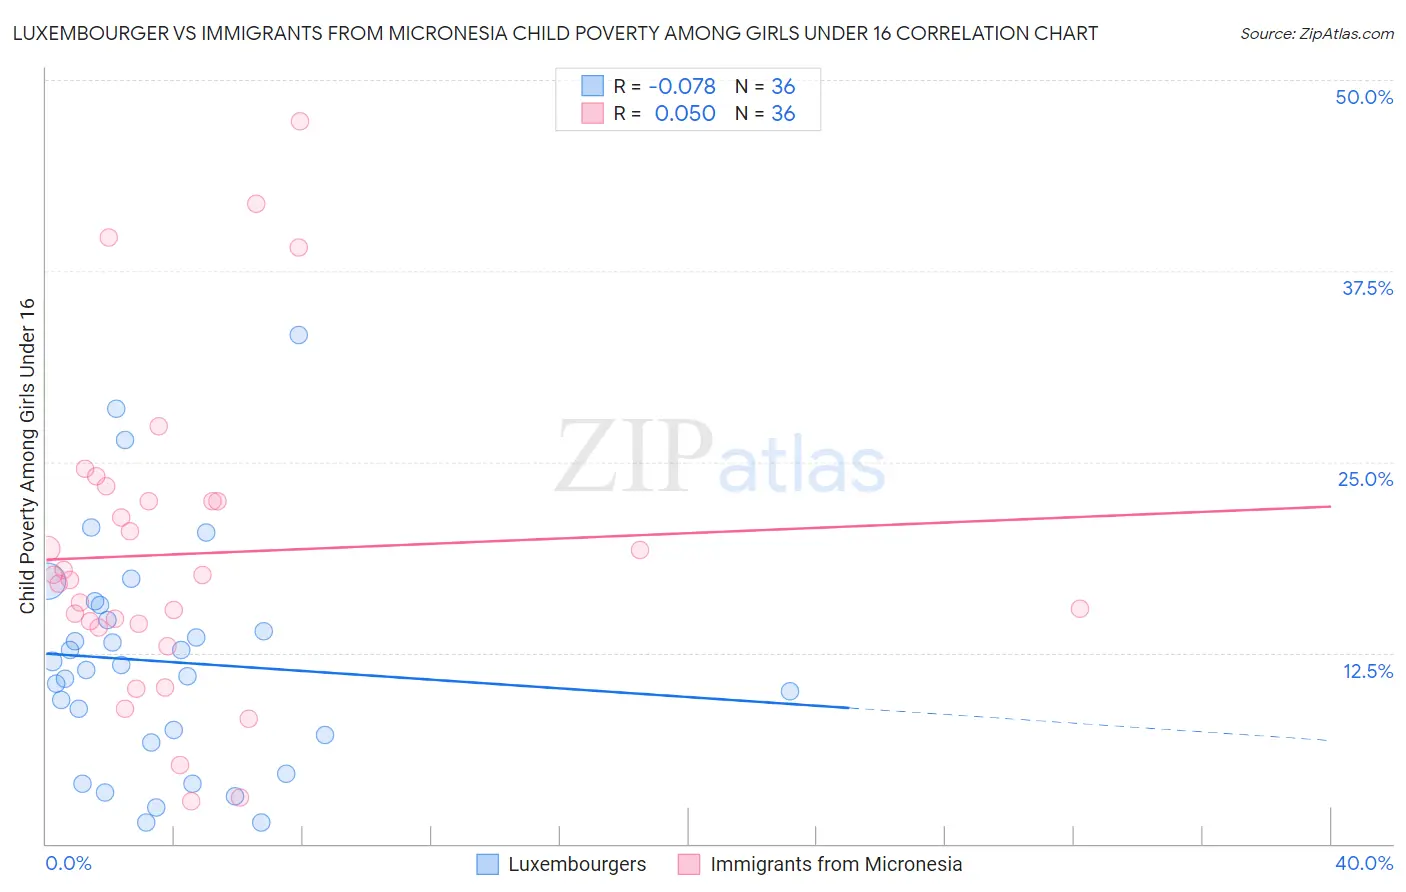
Luxembourger vs Immigrants from Micronesia Child Poverty Among Girls Under 16 Correlation Chart
The statistical analysis conducted on geographies consisting of 142,903,603 people shows a slight negative correlation between the proportion of Luxembourgers and poverty level among girls under the age of 16 in the United States with a correlation coefficient (R) of -0.078 and weighted average of 14.3%. Similarly, the statistical analysis conducted on geographies consisting of 61,520,772 people shows no correlation between the proportion of Immigrants from Micronesia and poverty level among girls under the age of 16 in the United States with a correlation coefficient (R) of 0.050 and weighted average of 18.0%, a difference of 26.3%.
Child Poverty Among Girls Under 16 Correlation Summary
| Measurement | Luxembourger | Immigrants from Micronesia |
| Minimum | 1.4% | 2.8% |
| Maximum | 33.3% | 47.3% |
| Range | 32.0% | 44.6% |
| Mean | 11.9% | 19.0% |
| Median | 11.6% | 17.4% |
| Interquartile 25% (IQ1) | 6.9% | 14.3% |
| Interquartile 75% (IQ3) | 15.2% | 22.4% |
| Interquartile Range (IQR) | 8.3% | 8.2% |
| Standard Deviation (Sample) | 7.4% | 10.2% |
| Standard Deviation (Population) | 7.3% | 10.0% |
Similar Demographics by Child Poverty Among Girls Under 16
Demographics Similar to Luxembourgers by Child Poverty Among Girls Under 16
In terms of child poverty among girls under 16, the demographic groups most similar to Luxembourgers are Italian (14.3%, a difference of 0.070%), Immigrants from Pakistan (14.2%, a difference of 0.21%), Estonian (14.3%, a difference of 0.43%), Immigrants from Romania (14.3%, a difference of 0.47%), and Immigrants from Indonesia (14.4%, a difference of 0.54%).
| Demographics | Rating | Rank | Child Poverty Among Girls Under 16 |
| Croatians | 99.3 /100 | #46 | Exceptional 14.1% |
| Immigrants | Czechoslovakia | 99.3 /100 | #47 | Exceptional 14.2% |
| Czechs | 99.3 /100 | #48 | Exceptional 14.2% |
| Greeks | 99.2 /100 | #49 | Exceptional 14.2% |
| Immigrants | Israel | 99.2 /100 | #50 | Exceptional 14.2% |
| Immigrants | Pakistan | 99.1 /100 | #51 | Exceptional 14.2% |
| Italians | 99.1 /100 | #52 | Exceptional 14.3% |
| Luxembourgers | 99.0 /100 | #53 | Exceptional 14.3% |
| Estonians | 98.9 /100 | #54 | Exceptional 14.3% |
| Immigrants | Romania | 98.9 /100 | #55 | Exceptional 14.3% |
| Immigrants | Indonesia | 98.9 /100 | #56 | Exceptional 14.4% |
| Immigrants | Serbia | 98.9 /100 | #57 | Exceptional 14.4% |
| Immigrants | Bulgaria | 98.8 /100 | #58 | Exceptional 14.4% |
| Zimbabweans | 98.8 /100 | #59 | Exceptional 14.4% |
| Poles | 98.7 /100 | #60 | Exceptional 14.4% |
Demographics Similar to Immigrants from Micronesia by Child Poverty Among Girls Under 16
In terms of child poverty among girls under 16, the demographic groups most similar to Immigrants from Micronesia are Cuban (18.0%, a difference of 0.43%), Immigrants from Cambodia (18.1%, a difference of 0.52%), Immigrants from Armenia (18.1%, a difference of 0.52%), Bermudan (18.1%, a difference of 0.60%), and Immigrants from Africa (18.2%, a difference of 0.69%).
| Demographics | Rating | Rank | Child Poverty Among Girls Under 16 |
| Malaysians | 5.7 /100 | #214 | Tragic 17.8% |
| German Russians | 5.7 /100 | #215 | Tragic 17.8% |
| Moroccans | 5.5 /100 | #216 | Tragic 17.8% |
| Japanese | 5.3 /100 | #217 | Tragic 17.8% |
| Alaska Natives | 5.2 /100 | #218 | Tragic 17.8% |
| Immigrants | Panama | 4.7 /100 | #219 | Tragic 17.9% |
| Cubans | 4.1 /100 | #220 | Tragic 18.0% |
| Immigrants | Micronesia | 3.5 /100 | #221 | Tragic 18.0% |
| Immigrants | Cambodia | 2.9 /100 | #222 | Tragic 18.1% |
| Immigrants | Armenia | 2.9 /100 | #223 | Tragic 18.1% |
| Bermudans | 2.8 /100 | #224 | Tragic 18.1% |
| Immigrants | Africa | 2.7 /100 | #225 | Tragic 18.2% |
| Nicaraguans | 2.4 /100 | #226 | Tragic 18.2% |
| Immigrants | Nonimmigrants | 2.0 /100 | #227 | Tragic 18.3% |
| Alaskan Athabascans | 2.0 /100 | #228 | Tragic 18.3% |