Lithuanian vs Immigrants from Micronesia Receiving Food Stamps
COMPARE
Lithuanian
Immigrants from Micronesia
Receiving Food Stamps
Receiving Food Stamps Comparison
Lithuanians
Immigrants from Micronesia
9.7%
RECEIVING FOOD STAMPS
99.4/ 100
METRIC RATING
50th/ 347
METRIC RANK
13.5%
RECEIVING FOOD STAMPS
1.3/ 100
METRIC RATING
239th/ 347
METRIC RANK
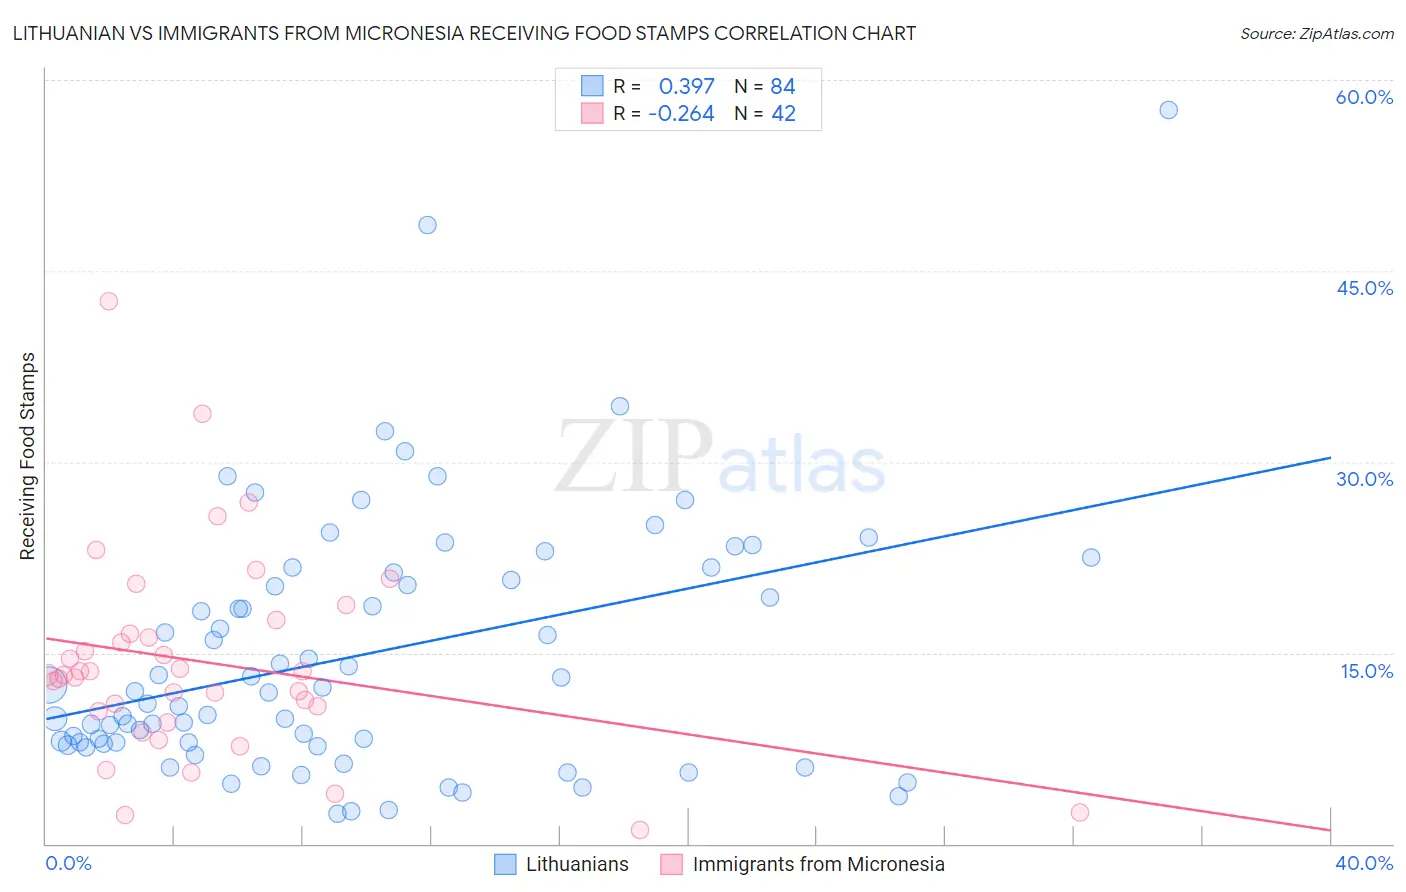
Lithuanian vs Immigrants from Micronesia Receiving Food Stamps Correlation Chart
The statistical analysis conducted on geographies consisting of 420,339,892 people shows a mild positive correlation between the proportion of Lithuanians and percentage of population receiving government assistance and/or food stamps in the United States with a correlation coefficient (R) of 0.397 and weighted average of 9.7%. Similarly, the statistical analysis conducted on geographies consisting of 61,597,185 people shows a weak negative correlation between the proportion of Immigrants from Micronesia and percentage of population receiving government assistance and/or food stamps in the United States with a correlation coefficient (R) of -0.264 and weighted average of 13.5%, a difference of 39.8%.
Receiving Food Stamps Correlation Summary
| Measurement | Lithuanian | Immigrants from Micronesia |
| Minimum | 2.4% | 1.1% |
| Maximum | 57.6% | 42.6% |
| Range | 55.2% | 41.5% |
| Mean | 14.8% | 14.3% |
| Median | 11.9% | 13.3% |
| Interquartile 25% (IQ1) | 7.9% | 10.4% |
| Interquartile 75% (IQ3) | 21.0% | 16.5% |
| Interquartile Range (IQR) | 13.1% | 6.1% |
| Standard Deviation (Sample) | 10.0% | 8.0% |
| Standard Deviation (Population) | 10.0% | 7.9% |
Similar Demographics by Receiving Food Stamps
Demographics Similar to Lithuanians by Receiving Food Stamps
In terms of receiving food stamps, the demographic groups most similar to Lithuanians are Asian (9.7%, a difference of 0.18%), Immigrants from South Africa (9.7%, a difference of 0.19%), Tongan (9.7%, a difference of 0.21%), Immigrants from Czechoslovakia (9.6%, a difference of 0.25%), and Russian (9.6%, a difference of 0.27%).
| Demographics | Rating | Rank | Receiving Food Stamps |
| Croatians | 99.5 /100 | #43 | Exceptional 9.6% |
| Immigrants | Denmark | 99.4 /100 | #44 | Exceptional 9.6% |
| Immigrants | Belgium | 99.4 /100 | #45 | Exceptional 9.6% |
| Australians | 99.4 /100 | #46 | Exceptional 9.6% |
| Indians (Asian) | 99.4 /100 | #47 | Exceptional 9.6% |
| Russians | 99.4 /100 | #48 | Exceptional 9.6% |
| Immigrants | Czechoslovakia | 99.4 /100 | #49 | Exceptional 9.6% |
| Lithuanians | 99.4 /100 | #50 | Exceptional 9.7% |
| Asians | 99.3 /100 | #51 | Exceptional 9.7% |
| Immigrants | South Africa | 99.3 /100 | #52 | Exceptional 9.7% |
| Tongans | 99.3 /100 | #53 | Exceptional 9.7% |
| Swiss | 99.3 /100 | #54 | Exceptional 9.7% |
| Immigrants | Switzerland | 99.3 /100 | #55 | Exceptional 9.7% |
| Immigrants | Canada | 99.3 /100 | #56 | Exceptional 9.7% |
| Greeks | 99.3 /100 | #57 | Exceptional 9.7% |
Demographics Similar to Immigrants from Micronesia by Receiving Food Stamps
In terms of receiving food stamps, the demographic groups most similar to Immigrants from Micronesia are French American Indian (13.5%, a difference of 0.23%), Iroquois (13.5%, a difference of 0.30%), Immigrants from El Salvador (13.5%, a difference of 0.42%), Crow (13.4%, a difference of 0.65%), and Choctaw (13.6%, a difference of 0.73%).
| Demographics | Rating | Rank | Receiving Food Stamps |
| Salvadorans | 2.7 /100 | #232 | Tragic 13.2% |
| Cherokee | 2.5 /100 | #233 | Tragic 13.2% |
| Comanche | 2.4 /100 | #234 | Tragic 13.3% |
| Immigrants | Zaire | 1.9 /100 | #235 | Tragic 13.4% |
| Crow | 1.6 /100 | #236 | Tragic 13.4% |
| Immigrants | El Salvador | 1.5 /100 | #237 | Tragic 13.5% |
| French American Indians | 1.4 /100 | #238 | Tragic 13.5% |
| Immigrants | Micronesia | 1.3 /100 | #239 | Tragic 13.5% |
| Iroquois | 1.2 /100 | #240 | Tragic 13.5% |
| Choctaw | 1.0 /100 | #241 | Tragic 13.6% |
| Immigrants | Panama | 1.0 /100 | #242 | Tragic 13.6% |
| Somalis | 0.9 /100 | #243 | Tragic 13.7% |
| Cajuns | 0.9 /100 | #244 | Tragic 13.7% |
| Immigrants | Somalia | 0.9 /100 | #245 | Tragic 13.7% |
| Cree | 0.8 /100 | #246 | Tragic 13.7% |