Czech vs Immigrants from Micronesia Receiving Food Stamps
COMPARE
Czech
Immigrants from Micronesia
Receiving Food Stamps
Receiving Food Stamps Comparison
Czechs
Immigrants from Micronesia
9.2%
RECEIVING FOOD STAMPS
99.8/ 100
METRIC RATING
28th/ 347
METRIC RANK
13.5%
RECEIVING FOOD STAMPS
1.3/ 100
METRIC RATING
239th/ 347
METRIC RANK
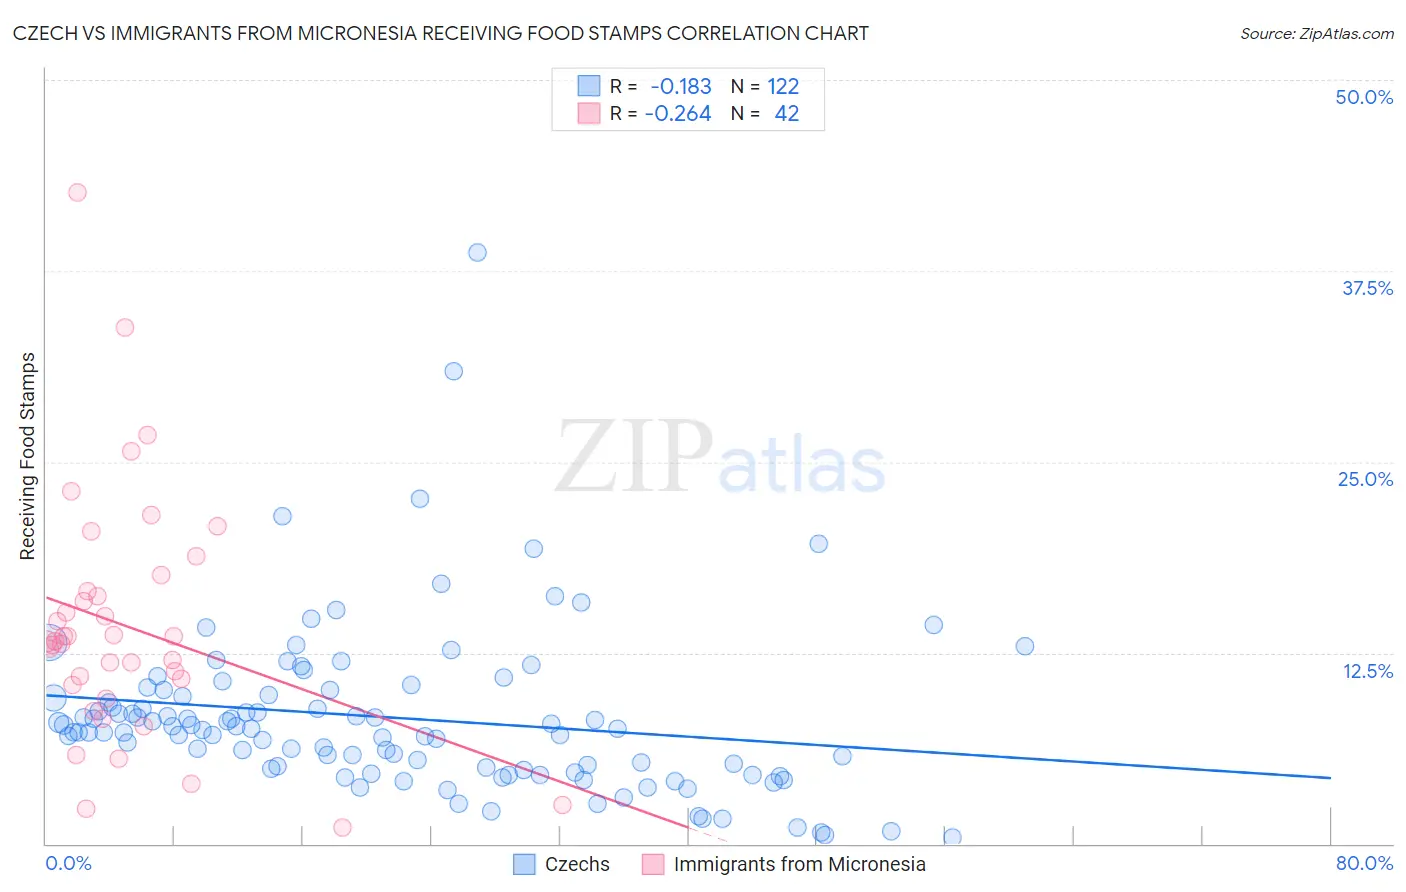
Czech vs Immigrants from Micronesia Receiving Food Stamps Correlation Chart
The statistical analysis conducted on geographies consisting of 482,652,589 people shows a poor negative correlation between the proportion of Czechs and percentage of population receiving government assistance and/or food stamps in the United States with a correlation coefficient (R) of -0.183 and weighted average of 9.2%. Similarly, the statistical analysis conducted on geographies consisting of 61,597,185 people shows a weak negative correlation between the proportion of Immigrants from Micronesia and percentage of population receiving government assistance and/or food stamps in the United States with a correlation coefficient (R) of -0.264 and weighted average of 13.5%, a difference of 46.5%.
Receiving Food Stamps Correlation Summary
| Measurement | Czech | Immigrants from Micronesia |
| Minimum | 0.40% | 1.1% |
| Maximum | 38.7% | 42.6% |
| Range | 38.3% | 41.5% |
| Mean | 8.3% | 14.3% |
| Median | 7.5% | 13.3% |
| Interquartile 25% (IQ1) | 4.9% | 10.4% |
| Interquartile 75% (IQ3) | 9.7% | 16.5% |
| Interquartile Range (IQR) | 4.8% | 6.1% |
| Standard Deviation (Sample) | 5.5% | 8.0% |
| Standard Deviation (Population) | 5.4% | 7.9% |
Similar Demographics by Receiving Food Stamps
Demographics Similar to Czechs by Receiving Food Stamps
In terms of receiving food stamps, the demographic groups most similar to Czechs are Bhutanese (9.2%, a difference of 0.010%), Swedish (9.2%, a difference of 0.25%), Immigrants from Lithuania (9.2%, a difference of 0.27%), Immigrants from Ireland (9.2%, a difference of 0.45%), and Immigrants from Northern Europe (9.2%, a difference of 0.55%).
| Demographics | Rating | Rank | Receiving Food Stamps |
| Luxembourgers | 99.8 /100 | #21 | Exceptional 9.1% |
| Immigrants | Australia | 99.8 /100 | #22 | Exceptional 9.2% |
| Eastern Europeans | 99.8 /100 | #23 | Exceptional 9.2% |
| Immigrants | Northern Europe | 99.8 /100 | #24 | Exceptional 9.2% |
| Immigrants | Ireland | 99.8 /100 | #25 | Exceptional 9.2% |
| Swedes | 99.8 /100 | #26 | Exceptional 9.2% |
| Bhutanese | 99.8 /100 | #27 | Exceptional 9.2% |
| Czechs | 99.8 /100 | #28 | Exceptional 9.2% |
| Immigrants | Lithuania | 99.8 /100 | #29 | Exceptional 9.2% |
| Immigrants | Sweden | 99.7 /100 | #30 | Exceptional 9.3% |
| Immigrants | Eastern Asia | 99.7 /100 | #31 | Exceptional 9.3% |
| Bolivians | 99.7 /100 | #32 | Exceptional 9.3% |
| Zimbabweans | 99.6 /100 | #33 | Exceptional 9.5% |
| Turks | 99.6 /100 | #34 | Exceptional 9.5% |
| Immigrants | Austria | 99.6 /100 | #35 | Exceptional 9.5% |
Demographics Similar to Immigrants from Micronesia by Receiving Food Stamps
In terms of receiving food stamps, the demographic groups most similar to Immigrants from Micronesia are French American Indian (13.5%, a difference of 0.23%), Iroquois (13.5%, a difference of 0.30%), Immigrants from El Salvador (13.5%, a difference of 0.42%), Crow (13.4%, a difference of 0.65%), and Choctaw (13.6%, a difference of 0.73%).
| Demographics | Rating | Rank | Receiving Food Stamps |
| Salvadorans | 2.7 /100 | #232 | Tragic 13.2% |
| Cherokee | 2.5 /100 | #233 | Tragic 13.2% |
| Comanche | 2.4 /100 | #234 | Tragic 13.3% |
| Immigrants | Zaire | 1.9 /100 | #235 | Tragic 13.4% |
| Crow | 1.6 /100 | #236 | Tragic 13.4% |
| Immigrants | El Salvador | 1.5 /100 | #237 | Tragic 13.5% |
| French American Indians | 1.4 /100 | #238 | Tragic 13.5% |
| Immigrants | Micronesia | 1.3 /100 | #239 | Tragic 13.5% |
| Iroquois | 1.2 /100 | #240 | Tragic 13.5% |
| Choctaw | 1.0 /100 | #241 | Tragic 13.6% |
| Immigrants | Panama | 1.0 /100 | #242 | Tragic 13.6% |
| Somalis | 0.9 /100 | #243 | Tragic 13.7% |
| Cajuns | 0.9 /100 | #244 | Tragic 13.7% |
| Immigrants | Somalia | 0.9 /100 | #245 | Tragic 13.7% |
| Cree | 0.8 /100 | #246 | Tragic 13.7% |