Immigrants from Thailand vs Paiute Single Mother Poverty
COMPARE
Immigrants from Thailand
Paiute
Single Mother Poverty
Single Mother Poverty Comparison
Immigrants from Thailand
Paiute
29.9%
SINGLE MOTHER POVERTY
12.0/ 100
METRIC RATING
213th/ 347
METRIC RANK
35.1%
SINGLE MOTHER POVERTY
0.0/ 100
METRIC RATING
321st/ 347
METRIC RANK
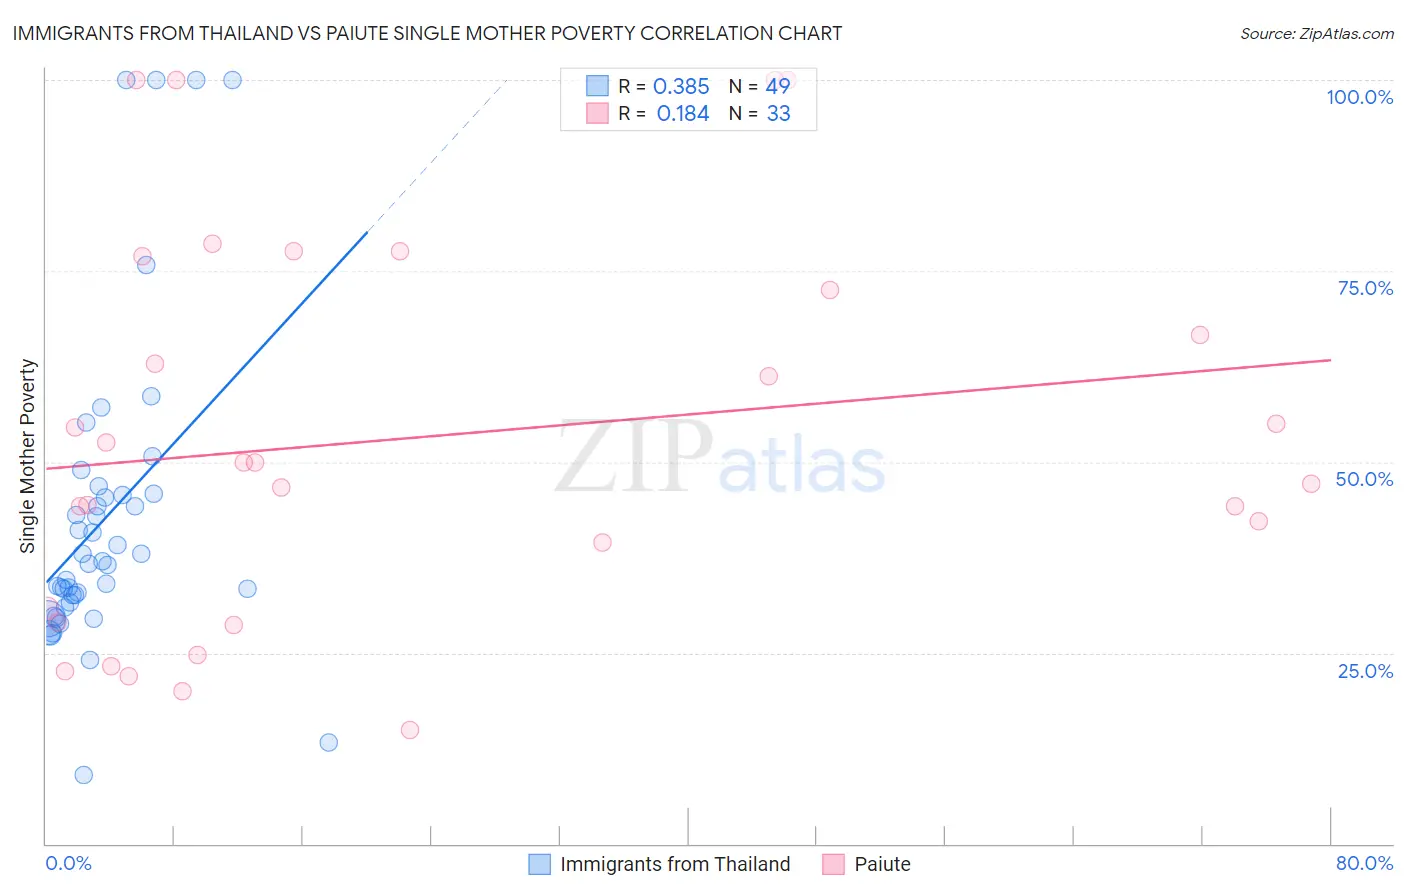
Immigrants from Thailand vs Paiute Single Mother Poverty Correlation Chart
The statistical analysis conducted on geographies consisting of 311,723,568 people shows a mild positive correlation between the proportion of Immigrants from Thailand and poverty level among single mothers in the United States with a correlation coefficient (R) of 0.385 and weighted average of 29.9%. Similarly, the statistical analysis conducted on geographies consisting of 58,096,720 people shows a poor positive correlation between the proportion of Paiute and poverty level among single mothers in the United States with a correlation coefficient (R) of 0.184 and weighted average of 35.1%, a difference of 17.7%.
Single Mother Poverty Correlation Summary
| Measurement | Immigrants from Thailand | Paiute |
| Minimum | 9.0% | 14.8% |
| Maximum | 100.0% | 100.0% |
| Range | 91.0% | 85.2% |
| Mean | 42.5% | 53.3% |
| Median | 36.7% | 50.0% |
| Interquartile 25% (IQ1) | 31.3% | 29.9% |
| Interquartile 75% (IQ3) | 45.8% | 74.7% |
| Interquartile Range (IQR) | 14.5% | 44.8% |
| Standard Deviation (Sample) | 20.5% | 25.3% |
| Standard Deviation (Population) | 20.3% | 24.9% |
Similar Demographics by Single Mother Poverty
Demographics Similar to Immigrants from Thailand by Single Mother Poverty
In terms of single mother poverty, the demographic groups most similar to Immigrants from Thailand are Liberian (29.9%, a difference of 0.030%), Jamaican (29.9%, a difference of 0.030%), Nicaraguan (29.8%, a difference of 0.050%), Immigrants from Western Africa (29.9%, a difference of 0.050%), and Immigrants from Ghana (29.9%, a difference of 0.080%).
| Demographics | Rating | Rank | Single Mother Poverty |
| Immigrants | Haiti | 15.8 /100 | #206 | Poor 29.7% |
| Immigrants | Panama | 15.5 /100 | #207 | Poor 29.8% |
| Immigrants | Guyana | 14.7 /100 | #208 | Poor 29.8% |
| Irish | 13.9 /100 | #209 | Poor 29.8% |
| Haitians | 13.3 /100 | #210 | Poor 29.8% |
| Guyanese | 12.8 /100 | #211 | Poor 29.8% |
| Nicaraguans | 12.4 /100 | #212 | Poor 29.8% |
| Immigrants | Thailand | 12.0 /100 | #213 | Poor 29.9% |
| Liberians | 11.7 /100 | #214 | Poor 29.9% |
| Jamaicans | 11.7 /100 | #215 | Poor 29.9% |
| Immigrants | Western Africa | 11.5 /100 | #216 | Poor 29.9% |
| Immigrants | Ghana | 11.3 /100 | #217 | Poor 29.9% |
| Hungarians | 10.3 /100 | #218 | Poor 29.9% |
| Finns | 9.3 /100 | #219 | Tragic 30.0% |
| Germans | 8.8 /100 | #220 | Tragic 30.0% |
Demographics Similar to Paiute by Single Mother Poverty
In terms of single mother poverty, the demographic groups most similar to Paiute are Black/African American (35.2%, a difference of 0.20%), Iroquois (34.8%, a difference of 0.87%), Kiowa (35.5%, a difference of 0.91%), Chippewa (34.8%, a difference of 1.1%), and Ottawa (35.5%, a difference of 1.1%).
| Demographics | Rating | Rank | Single Mother Poverty |
| Chickasaw | 0.0 /100 | #314 | Tragic 34.4% |
| Hopi | 0.0 /100 | #315 | Tragic 34.5% |
| Dominicans | 0.0 /100 | #316 | Tragic 34.5% |
| Cherokee | 0.0 /100 | #317 | Tragic 34.5% |
| Immigrants | Honduras | 0.0 /100 | #318 | Tragic 34.7% |
| Chippewa | 0.0 /100 | #319 | Tragic 34.8% |
| Iroquois | 0.0 /100 | #320 | Tragic 34.8% |
| Paiute | 0.0 /100 | #321 | Tragic 35.1% |
| Blacks/African Americans | 0.0 /100 | #322 | Tragic 35.2% |
| Kiowa | 0.0 /100 | #323 | Tragic 35.5% |
| Ottawa | 0.0 /100 | #324 | Tragic 35.5% |
| Ute | 0.0 /100 | #325 | Tragic 35.7% |
| Seminole | 0.0 /100 | #326 | Tragic 35.8% |
| Yakama | 0.0 /100 | #327 | Tragic 36.4% |
| Choctaw | 0.0 /100 | #328 | Tragic 36.4% |