Immigrants from Dominican Republic vs Paiute Single Mother Poverty
COMPARE
Immigrants from Dominican Republic
Paiute
Single Mother Poverty
Single Mother Poverty Comparison
Immigrants from Dominican Republic
Paiute
34.4%
SINGLE MOTHER POVERTY
0.0/ 100
METRIC RATING
313th/ 347
METRIC RANK
35.1%
SINGLE MOTHER POVERTY
0.0/ 100
METRIC RATING
321st/ 347
METRIC RANK
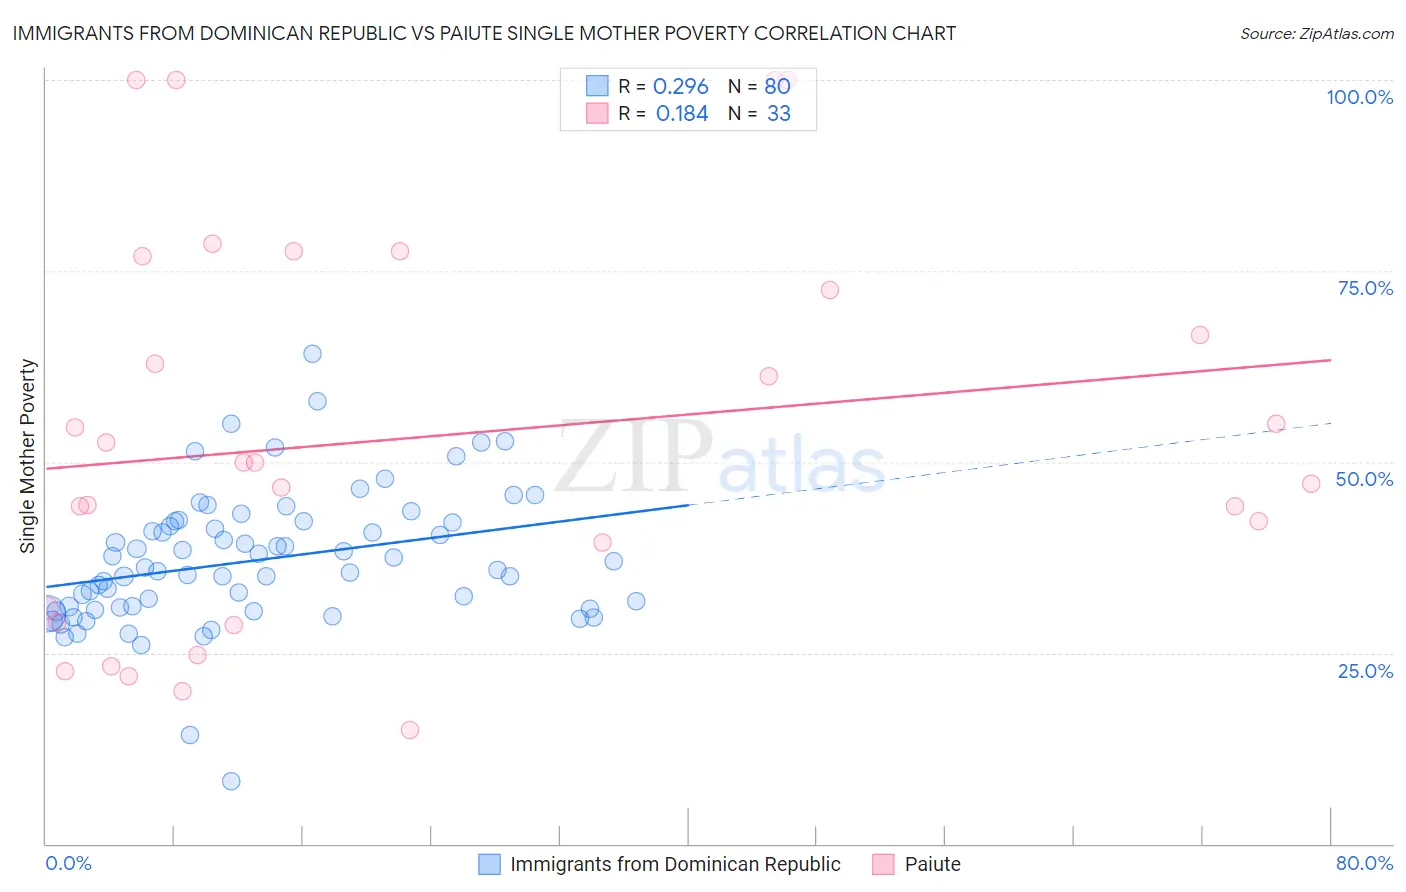
Immigrants from Dominican Republic vs Paiute Single Mother Poverty Correlation Chart
The statistical analysis conducted on geographies consisting of 269,699,812 people shows a weak positive correlation between the proportion of Immigrants from Dominican Republic and poverty level among single mothers in the United States with a correlation coefficient (R) of 0.296 and weighted average of 34.4%. Similarly, the statistical analysis conducted on geographies consisting of 58,096,720 people shows a poor positive correlation between the proportion of Paiute and poverty level among single mothers in the United States with a correlation coefficient (R) of 0.184 and weighted average of 35.1%, a difference of 2.3%.
Single Mother Poverty Correlation Summary
| Measurement | Immigrants from Dominican Republic | Paiute |
| Minimum | 8.3% | 14.8% |
| Maximum | 64.2% | 100.0% |
| Range | 56.0% | 85.2% |
| Mean | 37.1% | 53.3% |
| Median | 36.0% | 50.0% |
| Interquartile 25% (IQ1) | 30.8% | 29.9% |
| Interquartile 75% (IQ3) | 42.1% | 74.7% |
| Interquartile Range (IQR) | 11.3% | 44.8% |
| Standard Deviation (Sample) | 8.9% | 25.3% |
| Standard Deviation (Population) | 8.9% | 24.9% |
Demographics Similar to Immigrants from Dominican Republic and Paiute by Single Mother Poverty
In terms of single mother poverty, the demographic groups most similar to Immigrants from Dominican Republic are Central American Indian (34.3%, a difference of 0.080%), Alsatian (34.3%, a difference of 0.16%), Chickasaw (34.4%, a difference of 0.17%), Hopi (34.5%, a difference of 0.25%), and Dominican (34.5%, a difference of 0.37%). Similarly, the demographic groups most similar to Paiute are Black/African American (35.2%, a difference of 0.20%), Iroquois (34.8%, a difference of 0.87%), Kiowa (35.5%, a difference of 0.91%), Chippewa (34.8%, a difference of 1.1%), and Ottawa (35.5%, a difference of 1.1%).
| Demographics | Rating | Rank | Single Mother Poverty |
| Comanche | 0.0 /100 | #307 | Tragic 33.9% |
| Immigrants | Mexico | 0.0 /100 | #308 | Tragic 34.0% |
| Potawatomi | 0.0 /100 | #309 | Tragic 34.1% |
| Hondurans | 0.0 /100 | #310 | Tragic 34.2% |
| Alsatians | 0.0 /100 | #311 | Tragic 34.3% |
| Central American Indians | 0.0 /100 | #312 | Tragic 34.3% |
| Immigrants | Dominican Republic | 0.0 /100 | #313 | Tragic 34.4% |
| Chickasaw | 0.0 /100 | #314 | Tragic 34.4% |
| Hopi | 0.0 /100 | #315 | Tragic 34.5% |
| Dominicans | 0.0 /100 | #316 | Tragic 34.5% |
| Cherokee | 0.0 /100 | #317 | Tragic 34.5% |
| Immigrants | Honduras | 0.0 /100 | #318 | Tragic 34.7% |
| Chippewa | 0.0 /100 | #319 | Tragic 34.8% |
| Iroquois | 0.0 /100 | #320 | Tragic 34.8% |
| Paiute | 0.0 /100 | #321 | Tragic 35.1% |
| Blacks/African Americans | 0.0 /100 | #322 | Tragic 35.2% |
| Kiowa | 0.0 /100 | #323 | Tragic 35.5% |
| Ottawa | 0.0 /100 | #324 | Tragic 35.5% |
| Ute | 0.0 /100 | #325 | Tragic 35.7% |
| Seminole | 0.0 /100 | #326 | Tragic 35.8% |
| Yakama | 0.0 /100 | #327 | Tragic 36.4% |