Lumbee vs Ethiopian Single Mother Poverty
COMPARE
Lumbee
Ethiopian
Single Mother Poverty
Single Mother Poverty Comparison
Lumbee
Ethiopians
43.2%
SINGLE MOTHER POVERTY
0.0/ 100
METRIC RATING
345th/ 347
METRIC RANK
27.7%
SINGLE MOTHER POVERTY
98.4/ 100
METRIC RATING
88th/ 347
METRIC RANK
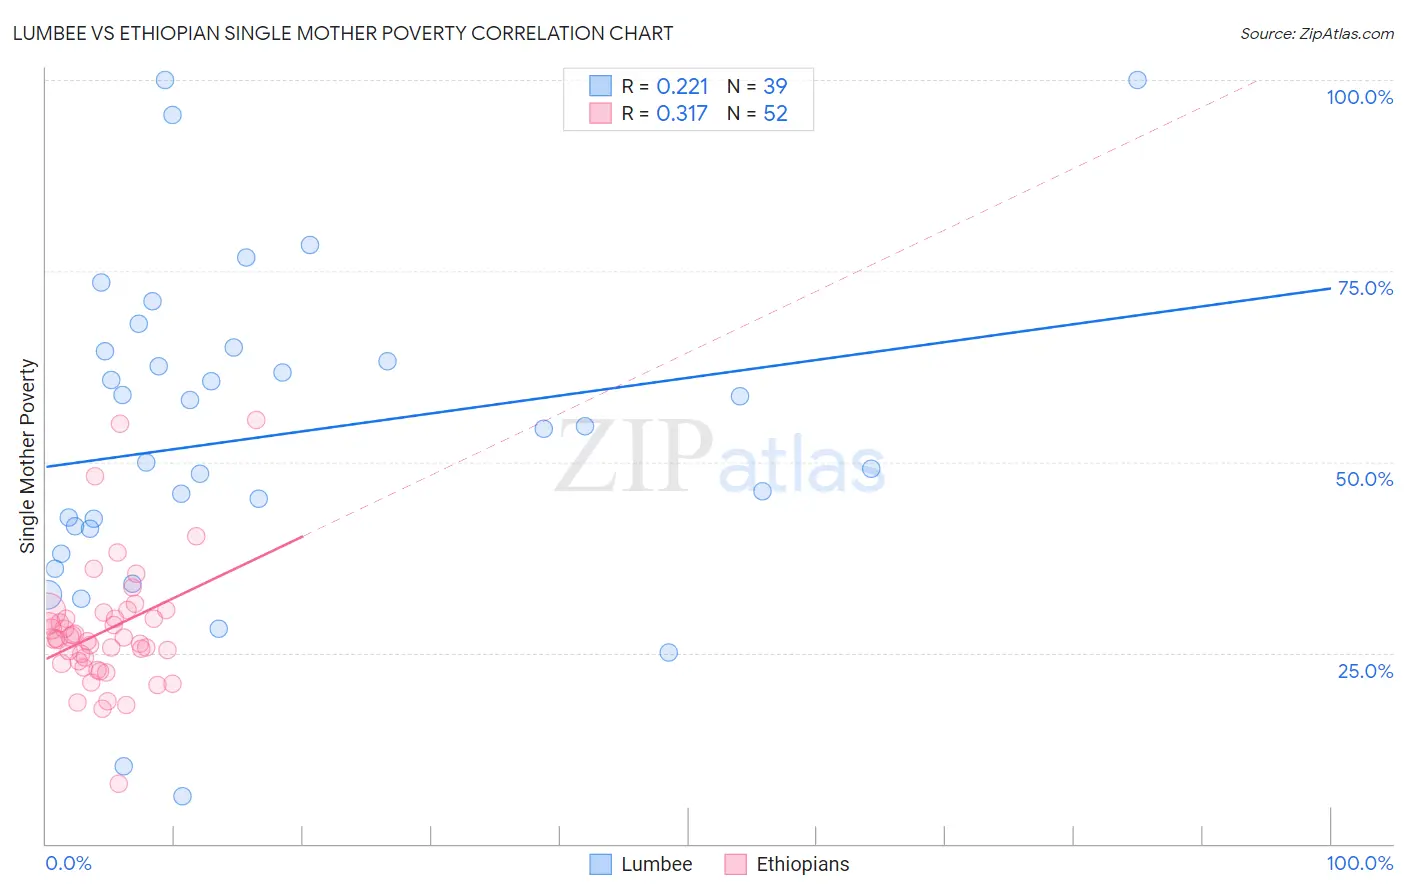
Lumbee vs Ethiopian Single Mother Poverty Correlation Chart
The statistical analysis conducted on geographies consisting of 91,530,918 people shows a weak positive correlation between the proportion of Lumbee and poverty level among single mothers in the United States with a correlation coefficient (R) of 0.221 and weighted average of 43.2%. Similarly, the statistical analysis conducted on geographies consisting of 220,975,245 people shows a mild positive correlation between the proportion of Ethiopians and poverty level among single mothers in the United States with a correlation coefficient (R) of 0.317 and weighted average of 27.7%, a difference of 56.0%.
Single Mother Poverty Correlation Summary
| Measurement | Lumbee | Ethiopian |
| Minimum | 6.2% | 7.9% |
| Maximum | 100.0% | 55.4% |
| Range | 93.8% | 47.5% |
| Mean | 53.4% | 27.9% |
| Median | 54.4% | 26.9% |
| Interquartile 25% (IQ1) | 41.2% | 23.7% |
| Interquartile 75% (IQ3) | 64.5% | 29.9% |
| Interquartile Range (IQR) | 23.4% | 6.1% |
| Standard Deviation (Sample) | 21.1% | 8.3% |
| Standard Deviation (Population) | 20.9% | 8.2% |
Similar Demographics by Single Mother Poverty
Demographics Similar to Lumbee by Single Mother Poverty
In terms of single mother poverty, the demographic groups most similar to Lumbee are Tohono O'odham (43.0%, a difference of 0.49%), Houma (43.5%, a difference of 0.62%), Puerto Rican (44.5%, a difference of 3.0%), Cajun (40.3%, a difference of 7.2%), and Navajo (40.2%, a difference of 7.5%).
| Demographics | Rating | Rank | Single Mother Poverty |
| Menominee | 0.0 /100 | #333 | Tragic 37.1% |
| Pueblo | 0.0 /100 | #334 | Tragic 37.2% |
| Yuman | 0.0 /100 | #335 | Tragic 37.8% |
| Cheyenne | 0.0 /100 | #336 | Tragic 38.5% |
| Immigrants | Yemen | 0.0 /100 | #337 | Tragic 38.5% |
| Pima | 0.0 /100 | #338 | Tragic 38.6% |
| Crow | 0.0 /100 | #339 | Tragic 38.6% |
| Sioux | 0.0 /100 | #340 | Tragic 38.8% |
| Colville | 0.0 /100 | #341 | Tragic 39.3% |
| Navajo | 0.0 /100 | #342 | Tragic 40.2% |
| Cajuns | 0.0 /100 | #343 | Tragic 40.3% |
| Tohono O'odham | 0.0 /100 | #344 | Tragic 43.0% |
| Lumbee | 0.0 /100 | #345 | Tragic 43.2% |
| Houma | 0.0 /100 | #346 | Tragic 43.5% |
| Puerto Ricans | 0.0 /100 | #347 | Tragic 44.5% |
Demographics Similar to Ethiopians by Single Mother Poverty
In terms of single mother poverty, the demographic groups most similar to Ethiopians are Afghan (27.7%, a difference of 0.020%), Immigrants from Ethiopia (27.7%, a difference of 0.020%), Immigrants from Ukraine (27.7%, a difference of 0.12%), Immigrants from France (27.8%, a difference of 0.19%), and Mongolian (27.7%, a difference of 0.21%).
| Demographics | Rating | Rank | Single Mother Poverty |
| Immigrants | Scotland | 98.9 /100 | #81 | Exceptional 27.6% |
| Immigrants | Cameroon | 98.8 /100 | #82 | Exceptional 27.6% |
| Greeks | 98.7 /100 | #83 | Exceptional 27.7% |
| Immigrants | Latvia | 98.7 /100 | #84 | Exceptional 27.7% |
| Mongolians | 98.7 /100 | #85 | Exceptional 27.7% |
| Immigrants | Ukraine | 98.6 /100 | #86 | Exceptional 27.7% |
| Afghans | 98.5 /100 | #87 | Exceptional 27.7% |
| Ethiopians | 98.4 /100 | #88 | Exceptional 27.7% |
| Immigrants | Ethiopia | 98.4 /100 | #89 | Exceptional 27.7% |
| Immigrants | France | 98.2 /100 | #90 | Exceptional 27.8% |
| Immigrants | Albania | 98.0 /100 | #91 | Exceptional 27.8% |
| Estonians | 97.9 /100 | #92 | Exceptional 27.8% |
| Romanians | 97.8 /100 | #93 | Exceptional 27.8% |
| Albanians | 97.6 /100 | #94 | Exceptional 27.9% |
| Chileans | 97.5 /100 | #95 | Exceptional 27.9% |