Immigrants from El Salvador vs Paiute Single Mother Poverty
COMPARE
Immigrants from El Salvador
Paiute
Single Mother Poverty
Single Mother Poverty Comparison
Immigrants from El Salvador
Paiute
31.2%
SINGLE MOTHER POVERTY
0.3/ 100
METRIC RATING
261st/ 347
METRIC RANK
35.1%
SINGLE MOTHER POVERTY
0.0/ 100
METRIC RATING
321st/ 347
METRIC RANK
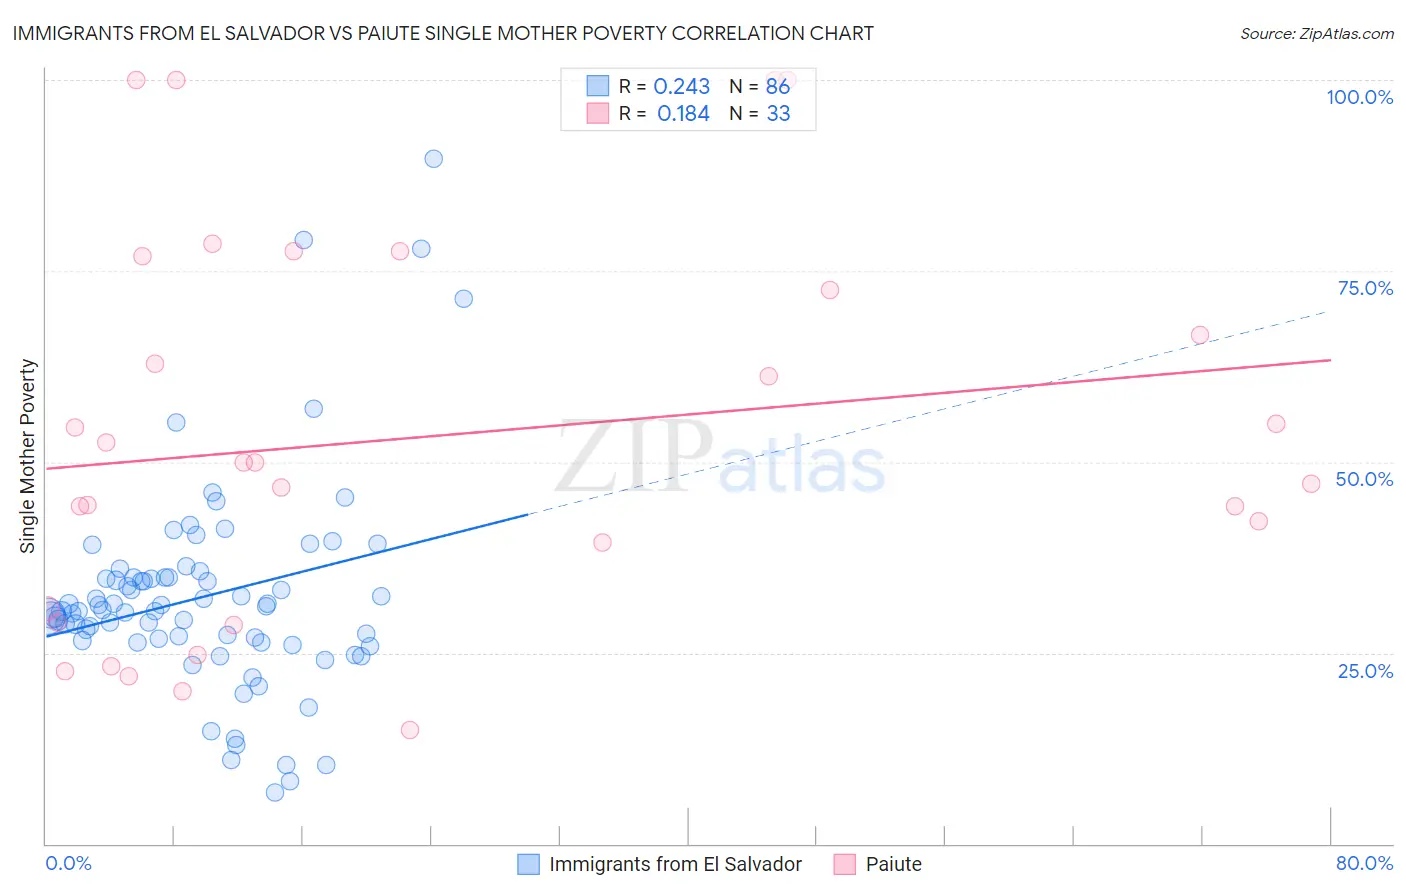
Immigrants from El Salvador vs Paiute Single Mother Poverty Correlation Chart
The statistical analysis conducted on geographies consisting of 352,610,814 people shows a weak positive correlation between the proportion of Immigrants from El Salvador and poverty level among single mothers in the United States with a correlation coefficient (R) of 0.243 and weighted average of 31.2%. Similarly, the statistical analysis conducted on geographies consisting of 58,096,720 people shows a poor positive correlation between the proportion of Paiute and poverty level among single mothers in the United States with a correlation coefficient (R) of 0.184 and weighted average of 35.1%, a difference of 12.6%.
Single Mother Poverty Correlation Summary
| Measurement | Immigrants from El Salvador | Paiute |
| Minimum | 6.7% | 14.8% |
| Maximum | 89.6% | 100.0% |
| Range | 83.0% | 85.2% |
| Mean | 32.4% | 53.3% |
| Median | 30.6% | 50.0% |
| Interquartile 25% (IQ1) | 26.6% | 29.9% |
| Interquartile 75% (IQ3) | 34.8% | 74.7% |
| Interquartile Range (IQR) | 8.2% | 44.8% |
| Standard Deviation (Sample) | 13.9% | 25.3% |
| Standard Deviation (Population) | 13.8% | 24.9% |
Similar Demographics by Single Mother Poverty
Demographics Similar to Immigrants from El Salvador by Single Mother Poverty
In terms of single mother poverty, the demographic groups most similar to Immigrants from El Salvador are White/Caucasian (31.2%, a difference of 0.080%), Hmong (31.2%, a difference of 0.14%), Immigrants from Bangladesh (31.1%, a difference of 0.23%), Immigrants from Caribbean (31.1%, a difference of 0.27%), and Immigrants from Bahamas (31.1%, a difference of 0.35%).
| Demographics | Rating | Rank | Single Mother Poverty |
| Senegalese | 0.5 /100 | #254 | Tragic 31.0% |
| Belizeans | 0.5 /100 | #255 | Tragic 31.0% |
| Immigrants | West Indies | 0.4 /100 | #256 | Tragic 31.1% |
| Immigrants | Bahamas | 0.4 /100 | #257 | Tragic 31.1% |
| Immigrants | Caribbean | 0.4 /100 | #258 | Tragic 31.1% |
| Immigrants | Bangladesh | 0.4 /100 | #259 | Tragic 31.1% |
| Whites/Caucasians | 0.3 /100 | #260 | Tragic 31.2% |
| Immigrants | El Salvador | 0.3 /100 | #261 | Tragic 31.2% |
| Hmong | 0.3 /100 | #262 | Tragic 31.2% |
| Bahamians | 0.2 /100 | #263 | Tragic 31.3% |
| Immigrants | Ecuador | 0.2 /100 | #264 | Tragic 31.3% |
| German Russians | 0.2 /100 | #265 | Tragic 31.3% |
| Sub-Saharan Africans | 0.2 /100 | #266 | Tragic 31.4% |
| Immigrants | Belize | 0.2 /100 | #267 | Tragic 31.4% |
| Immigrants | Senegal | 0.1 /100 | #268 | Tragic 31.5% |
Demographics Similar to Paiute by Single Mother Poverty
In terms of single mother poverty, the demographic groups most similar to Paiute are Black/African American (35.2%, a difference of 0.20%), Iroquois (34.8%, a difference of 0.87%), Kiowa (35.5%, a difference of 0.91%), Chippewa (34.8%, a difference of 1.1%), and Ottawa (35.5%, a difference of 1.1%).
| Demographics | Rating | Rank | Single Mother Poverty |
| Chickasaw | 0.0 /100 | #314 | Tragic 34.4% |
| Hopi | 0.0 /100 | #315 | Tragic 34.5% |
| Dominicans | 0.0 /100 | #316 | Tragic 34.5% |
| Cherokee | 0.0 /100 | #317 | Tragic 34.5% |
| Immigrants | Honduras | 0.0 /100 | #318 | Tragic 34.7% |
| Chippewa | 0.0 /100 | #319 | Tragic 34.8% |
| Iroquois | 0.0 /100 | #320 | Tragic 34.8% |
| Paiute | 0.0 /100 | #321 | Tragic 35.1% |
| Blacks/African Americans | 0.0 /100 | #322 | Tragic 35.2% |
| Kiowa | 0.0 /100 | #323 | Tragic 35.5% |
| Ottawa | 0.0 /100 | #324 | Tragic 35.5% |
| Ute | 0.0 /100 | #325 | Tragic 35.7% |
| Seminole | 0.0 /100 | #326 | Tragic 35.8% |
| Yakama | 0.0 /100 | #327 | Tragic 36.4% |
| Choctaw | 0.0 /100 | #328 | Tragic 36.4% |