Lumbee vs Czech Single Female Poverty
COMPARE
Lumbee
Czech
Single Female Poverty
Single Female Poverty Comparison
Lumbee
Czechs
33.0%
SINGLE FEMALE POVERTY
0.0/ 100
METRIC RATING
344th/ 347
METRIC RANK
21.0%
SINGLE FEMALE POVERTY
46.8/ 100
METRIC RATING
175th/ 347
METRIC RANK
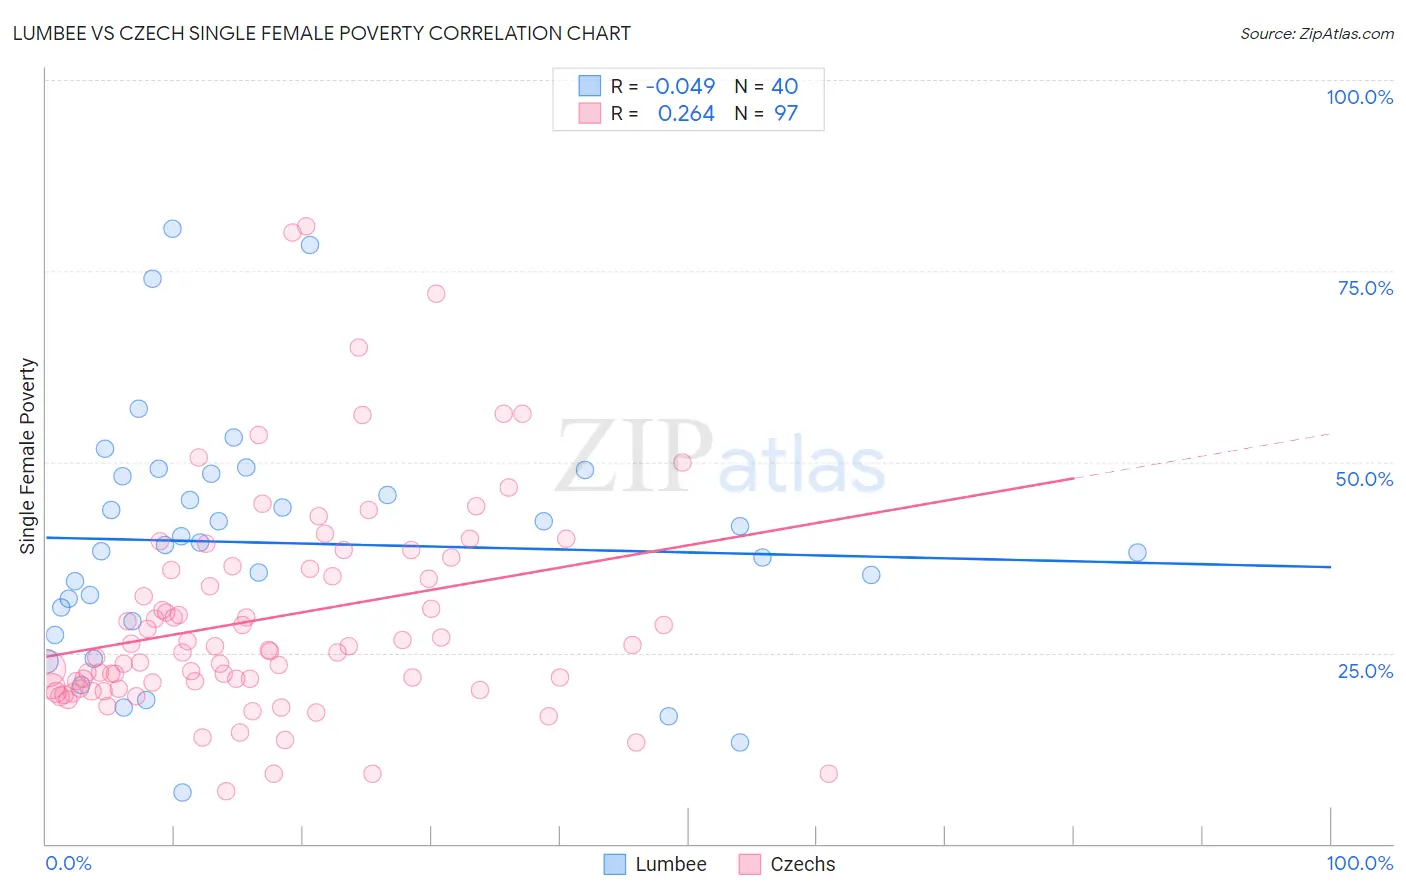
Lumbee vs Czech Single Female Poverty Correlation Chart
The statistical analysis conducted on geographies consisting of 91,816,335 people shows no correlation between the proportion of Lumbee and poverty level among single females in the United States with a correlation coefficient (R) of -0.049 and weighted average of 33.0%. Similarly, the statistical analysis conducted on geographies consisting of 472,282,128 people shows a weak positive correlation between the proportion of Czechs and poverty level among single females in the United States with a correlation coefficient (R) of 0.264 and weighted average of 21.0%, a difference of 56.8%.
Single Female Poverty Correlation Summary
| Measurement | Lumbee | Czech |
| Minimum | 6.8% | 6.8% |
| Maximum | 80.6% | 80.9% |
| Range | 73.8% | 74.1% |
| Mean | 39.4% | 29.6% |
| Median | 39.3% | 25.3% |
| Interquartile 25% (IQ1) | 30.1% | 20.5% |
| Interquartile 75% (IQ3) | 48.3% | 36.2% |
| Interquartile Range (IQR) | 18.2% | 15.7% |
| Standard Deviation (Sample) | 16.1% | 14.3% |
| Standard Deviation (Population) | 15.9% | 14.3% |
Similar Demographics by Single Female Poverty
Demographics Similar to Lumbee by Single Female Poverty
In terms of single female poverty, the demographic groups most similar to Lumbee are Crow (32.4%, a difference of 1.8%), Houma (33.8%, a difference of 2.4%), Puerto Rican (34.1%, a difference of 3.3%), Tohono O'odham (34.2%, a difference of 3.6%), and Navajo (31.7%, a difference of 4.3%).
| Demographics | Rating | Rank | Single Female Poverty |
| Ute | 0.0 /100 | #333 | Tragic 28.4% |
| Pueblo | 0.0 /100 | #334 | Tragic 28.6% |
| Immigrants | Yemen | 0.0 /100 | #335 | Tragic 28.9% |
| Colville | 0.0 /100 | #336 | Tragic 29.1% |
| Yuman | 0.0 /100 | #337 | Tragic 29.4% |
| Pima | 0.0 /100 | #338 | Tragic 30.3% |
| Cheyenne | 0.0 /100 | #339 | Tragic 30.4% |
| Cajuns | 0.0 /100 | #340 | Tragic 30.6% |
| Sioux | 0.0 /100 | #341 | Tragic 31.3% |
| Navajo | 0.0 /100 | #342 | Tragic 31.7% |
| Crow | 0.0 /100 | #343 | Tragic 32.4% |
| Lumbee | 0.0 /100 | #344 | Tragic 33.0% |
| Houma | 0.0 /100 | #345 | Tragic 33.8% |
| Puerto Ricans | 0.0 /100 | #346 | Tragic 34.1% |
| Tohono O'odham | 0.0 /100 | #347 | Tragic 34.2% |
Demographics Similar to Czechs by Single Female Poverty
In terms of single female poverty, the demographic groups most similar to Czechs are Canadian (21.1%, a difference of 0.080%), Scandinavian (21.1%, a difference of 0.10%), Immigrants from Bosnia and Herzegovina (21.1%, a difference of 0.12%), Cuban (21.0%, a difference of 0.20%), and Immigrants from Guyana (21.0%, a difference of 0.24%).
| Demographics | Rating | Rank | Single Female Poverty |
| Immigrants | Costa Rica | 61.5 /100 | #168 | Good 20.9% |
| Immigrants | Trinidad and Tobago | 56.3 /100 | #169 | Average 20.9% |
| New Zealanders | 53.2 /100 | #170 | Average 21.0% |
| Moroccans | 52.8 /100 | #171 | Average 21.0% |
| Guyanese | 52.0 /100 | #172 | Average 21.0% |
| Immigrants | Guyana | 50.6 /100 | #173 | Average 21.0% |
| Cubans | 50.0 /100 | #174 | Average 21.0% |
| Czechs | 46.8 /100 | #175 | Average 21.0% |
| Canadians | 45.4 /100 | #176 | Average 21.1% |
| Scandinavians | 45.2 /100 | #177 | Average 21.1% |
| Immigrants | Bosnia and Herzegovina | 44.9 /100 | #178 | Average 21.1% |
| British | 42.9 /100 | #179 | Average 21.1% |
| Spanish American Indians | 42.5 /100 | #180 | Average 21.1% |
| Europeans | 42.3 /100 | #181 | Average 21.1% |
| Slavs | 40.5 /100 | #182 | Average 21.1% |