Lumbee vs Czech Professional Degree
COMPARE
Lumbee
Czech
Professional Degree
Professional Degree Comparison
Lumbee
Czechs
2.5%
PROFESSIONAL DEGREE
0.0/ 100
METRIC RATING
346th/ 347
METRIC RANK
4.4%
PROFESSIONAL DEGREE
44.9/ 100
METRIC RATING
180th/ 347
METRIC RANK
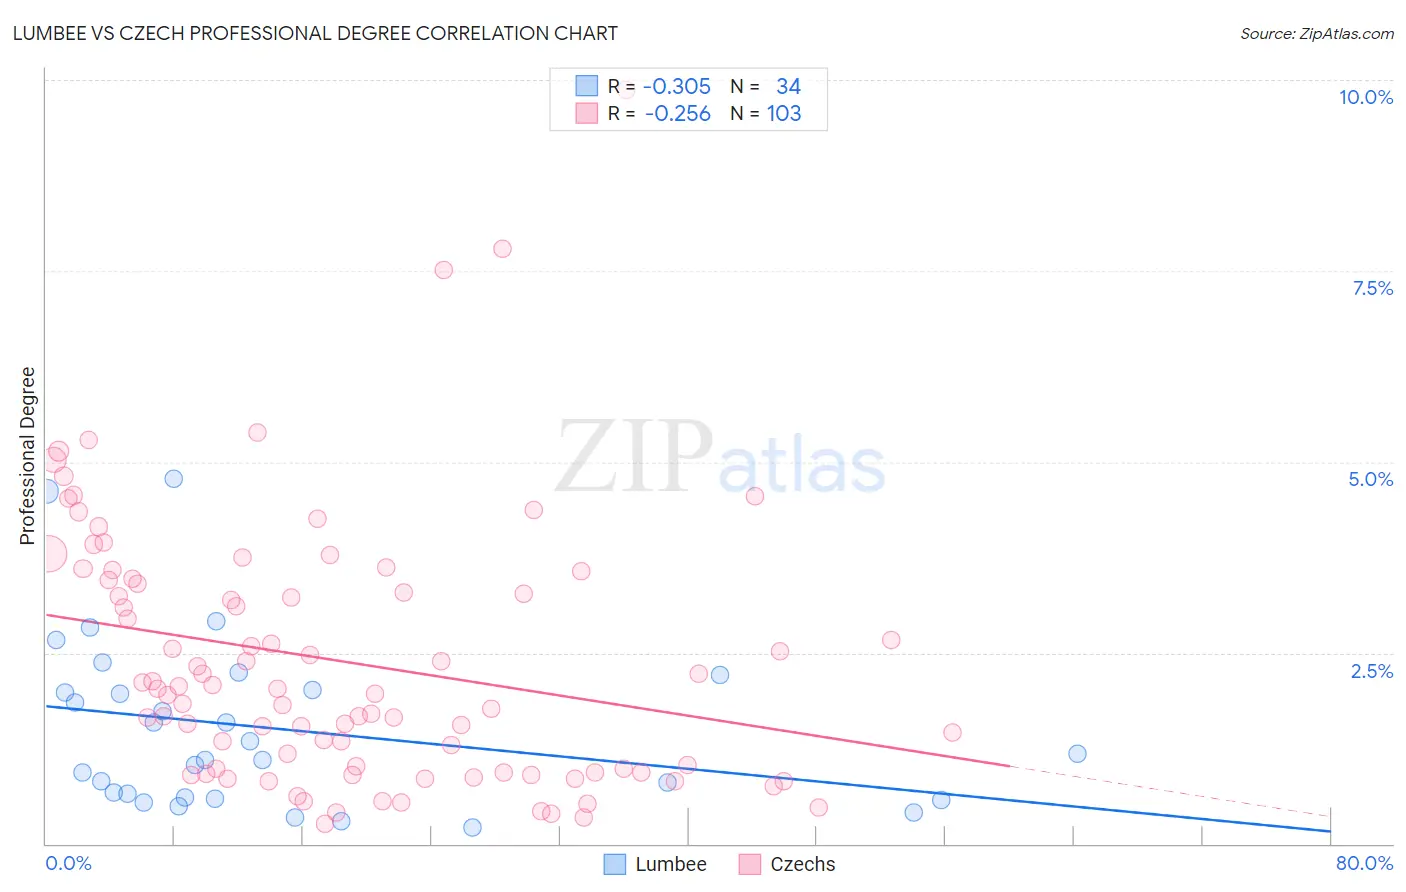
Lumbee vs Czech Professional Degree Correlation Chart
The statistical analysis conducted on geographies consisting of 92,157,121 people shows a mild negative correlation between the proportion of Lumbee and percentage of population with at least professional degree education in the United States with a correlation coefficient (R) of -0.305 and weighted average of 2.5%. Similarly, the statistical analysis conducted on geographies consisting of 481,986,557 people shows a weak negative correlation between the proportion of Czechs and percentage of population with at least professional degree education in the United States with a correlation coefficient (R) of -0.256 and weighted average of 4.4%, a difference of 77.6%.
Professional Degree Correlation Summary
| Measurement | Lumbee | Czech |
| Minimum | 0.22% | 0.26% |
| Maximum | 4.8% | 9.9% |
| Range | 4.6% | 9.6% |
| Mean | 1.5% | 2.4% |
| Median | 1.1% | 2.0% |
| Interquartile 25% (IQ1) | 0.60% | 0.93% |
| Interquartile 75% (IQ3) | 2.0% | 3.5% |
| Interquartile Range (IQR) | 1.4% | 2.5% |
| Standard Deviation (Sample) | 1.1% | 1.7% |
| Standard Deviation (Population) | 1.1% | 1.7% |
Similar Demographics by Professional Degree
Demographics Similar to Lumbee by Professional Degree
In terms of professional degree, the demographic groups most similar to Lumbee are Immigrants from Mexico (2.6%, a difference of 7.4%), Spanish American Indian (2.7%, a difference of 7.7%), Houma (2.2%, a difference of 11.1%), Mexican (2.7%, a difference of 11.7%), and Immigrants from the Azores (2.8%, a difference of 14.8%).
| Demographics | Rating | Rank | Professional Degree |
| Puget Sound Salish | 0.0 /100 | #333 | Tragic 3.1% |
| Pennsylvania Germans | 0.0 /100 | #334 | Tragic 3.0% |
| Natives/Alaskans | 0.0 /100 | #335 | Tragic 3.0% |
| Fijians | 0.0 /100 | #336 | Tragic 2.9% |
| Arapaho | 0.0 /100 | #337 | Tragic 2.9% |
| Navajo | 0.0 /100 | #338 | Tragic 2.9% |
| Immigrants | Central America | 0.0 /100 | #339 | Tragic 2.9% |
| Yup'ik | 0.0 /100 | #340 | Tragic 2.9% |
| Tohono O'odham | 0.0 /100 | #341 | Tragic 2.8% |
| Immigrants | Azores | 0.0 /100 | #342 | Tragic 2.8% |
| Mexicans | 0.0 /100 | #343 | Tragic 2.7% |
| Spanish American Indians | 0.0 /100 | #344 | Tragic 2.7% |
| Immigrants | Mexico | 0.0 /100 | #345 | Tragic 2.6% |
| Lumbee | 0.0 /100 | #346 | Tragic 2.5% |
| Houma | 0.0 /100 | #347 | Tragic 2.2% |
Demographics Similar to Czechs by Professional Degree
In terms of professional degree, the demographic groups most similar to Czechs are Immigrants from Kenya (4.4%, a difference of 0.15%), Danish (4.4%, a difference of 0.22%), Immigrants from Costa Rica (4.4%, a difference of 0.26%), Immigrants (4.4%, a difference of 0.26%), and Bermudan (4.4%, a difference of 0.28%).
| Demographics | Rating | Rank | Professional Degree |
| English | 50.1 /100 | #173 | Average 4.4% |
| Kenyans | 50.0 /100 | #174 | Average 4.4% |
| Irish | 50.0 /100 | #175 | Average 4.4% |
| Immigrants | Peru | 49.3 /100 | #176 | Average 4.4% |
| Celtics | 47.6 /100 | #177 | Average 4.4% |
| Immigrants | Costa Rica | 46.7 /100 | #178 | Average 4.4% |
| Immigrants | Kenya | 45.9 /100 | #179 | Average 4.4% |
| Czechs | 44.9 /100 | #180 | Average 4.4% |
| Danes | 43.5 /100 | #181 | Average 4.4% |
| Immigrants | Immigrants | 43.2 /100 | #182 | Average 4.4% |
| Bermudans | 43.1 /100 | #183 | Average 4.4% |
| Belgians | 36.2 /100 | #184 | Fair 4.3% |
| Welsh | 35.8 /100 | #185 | Fair 4.3% |
| Scotch-Irish | 34.2 /100 | #186 | Fair 4.3% |
| Immigrants | Cameroon | 33.3 /100 | #187 | Fair 4.3% |