Lithuanian vs Immigrants from Zaire In Labor Force | Age 20-64
COMPARE
Lithuanian
Immigrants from Zaire
In Labor Force | Age 20-64
In Labor Force | Age 20-64 Comparison
Lithuanians
Immigrants from Zaire
80.2%
IN LABOR FORCE | AGE 20-64
98.7/ 100
METRIC RATING
65th/ 347
METRIC RANK
79.9%
IN LABOR FORCE | AGE 20-64
88.6/ 100
METRIC RATING
130th/ 347
METRIC RANK
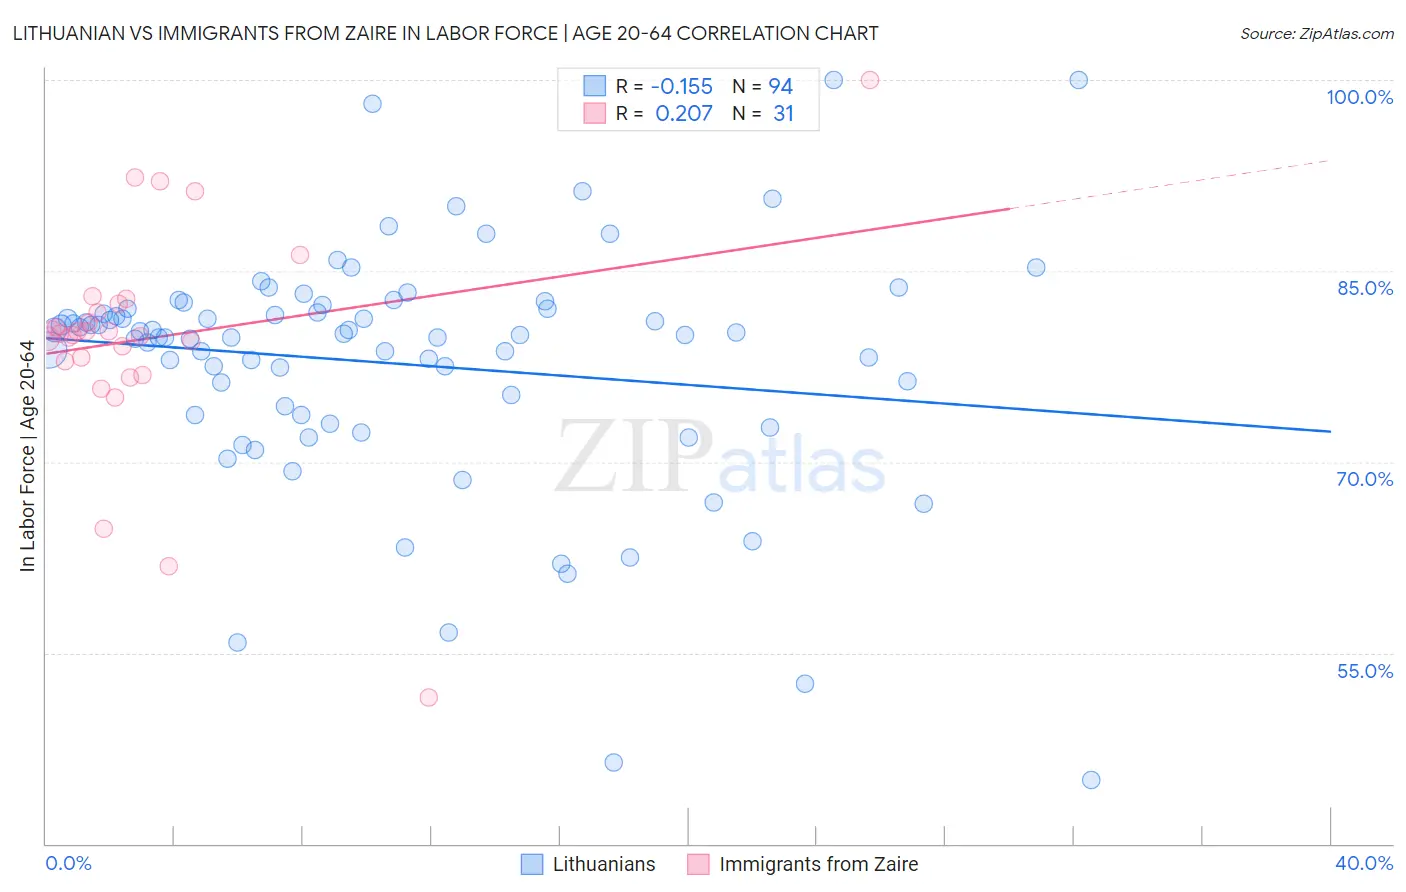
Lithuanian vs Immigrants from Zaire In Labor Force | Age 20-64 Correlation Chart
The statistical analysis conducted on geographies consisting of 421,962,111 people shows a poor negative correlation between the proportion of Lithuanians and labor force participation rate among population between the ages 20 and 64 in the United States with a correlation coefficient (R) of -0.155 and weighted average of 80.2%. Similarly, the statistical analysis conducted on geographies consisting of 107,255,436 people shows a weak positive correlation between the proportion of Immigrants from Zaire and labor force participation rate among population between the ages 20 and 64 in the United States with a correlation coefficient (R) of 0.207 and weighted average of 79.9%, a difference of 0.45%.
In Labor Force | Age 20-64 Correlation Summary
| Measurement | Lithuanian | Immigrants from Zaire |
| Minimum | 45.0% | 51.5% |
| Maximum | 100.0% | 100.0% |
| Range | 55.0% | 48.5% |
| Mean | 77.7% | 79.7% |
| Median | 80.0% | 80.0% |
| Interquartile 25% (IQ1) | 73.7% | 77.9% |
| Interquartile 75% (IQ3) | 82.0% | 82.4% |
| Interquartile Range (IQR) | 8.3% | 4.5% |
| Standard Deviation (Sample) | 9.6% | 8.8% |
| Standard Deviation (Population) | 9.5% | 8.7% |
Similar Demographics by In Labor Force | Age 20-64
Demographics Similar to Lithuanians by In Labor Force | Age 20-64
In terms of in labor force | age 20-64, the demographic groups most similar to Lithuanians are Macedonian (80.2%, a difference of 0.0%), Immigrants from Korea (80.3%, a difference of 0.010%), Immigrants from Albania (80.3%, a difference of 0.010%), Taiwanese (80.2%, a difference of 0.010%), and Carpatho Rusyn (80.3%, a difference of 0.020%).
| Demographics | Rating | Rank | In Labor Force | Age 20-64 |
| Serbians | 98.9 /100 | #58 | Exceptional 80.3% |
| Swedes | 98.9 /100 | #59 | Exceptional 80.3% |
| Tongans | 98.8 /100 | #60 | Exceptional 80.3% |
| Burmese | 98.8 /100 | #61 | Exceptional 80.3% |
| Carpatho Rusyns | 98.8 /100 | #62 | Exceptional 80.3% |
| Immigrants | Korea | 98.8 /100 | #63 | Exceptional 80.3% |
| Immigrants | Albania | 98.7 /100 | #64 | Exceptional 80.3% |
| Lithuanians | 98.7 /100 | #65 | Exceptional 80.2% |
| Macedonians | 98.7 /100 | #66 | Exceptional 80.2% |
| Taiwanese | 98.6 /100 | #67 | Exceptional 80.2% |
| Bhutanese | 98.6 /100 | #68 | Exceptional 80.2% |
| Albanians | 98.6 /100 | #69 | Exceptional 80.2% |
| Immigrants | Turkey | 98.5 /100 | #70 | Exceptional 80.2% |
| Soviet Union | 98.5 /100 | #71 | Exceptional 80.2% |
| Eastern Europeans | 98.4 /100 | #72 | Exceptional 80.2% |
Demographics Similar to Immigrants from Zaire by In Labor Force | Age 20-64
In terms of in labor force | age 20-64, the demographic groups most similar to Immigrants from Zaire are Italian (79.9%, a difference of 0.010%), Immigrants from Iran (79.9%, a difference of 0.010%), Immigrants from Czechoslovakia (79.9%, a difference of 0.020%), Immigrants from Eastern Asia (79.9%, a difference of 0.020%), and Indian (Asian) (79.9%, a difference of 0.020%).
| Demographics | Rating | Rank | In Labor Force | Age 20-64 |
| Immigrants | Russia | 91.8 /100 | #123 | Exceptional 79.9% |
| Immigrants | Europe | 91.6 /100 | #124 | Exceptional 79.9% |
| Danes | 91.5 /100 | #125 | Exceptional 79.9% |
| Immigrants | France | 90.7 /100 | #126 | Exceptional 79.9% |
| Immigrants | Czechoslovakia | 89.7 /100 | #127 | Excellent 79.9% |
| Immigrants | Eastern Asia | 89.4 /100 | #128 | Excellent 79.9% |
| Italians | 88.9 /100 | #129 | Excellent 79.9% |
| Immigrants | Zaire | 88.6 /100 | #130 | Excellent 79.9% |
| Immigrants | Iran | 88.3 /100 | #131 | Excellent 79.9% |
| Indians (Asian) | 87.7 /100 | #132 | Excellent 79.9% |
| South American Indians | 87.6 /100 | #133 | Excellent 79.9% |
| Belgians | 87.4 /100 | #134 | Excellent 79.9% |
| Ukrainians | 86.8 /100 | #135 | Excellent 79.9% |
| Immigrants | Singapore | 86.7 /100 | #136 | Excellent 79.9% |
| Immigrants | Ukraine | 86.5 /100 | #137 | Excellent 79.9% |