Australian vs Ethiopian Family Poverty
COMPARE
Australian
Ethiopian
Family Poverty
Family Poverty Comparison
Australians
Ethiopians
7.8%
FAMILY POVERTY
98.2/ 100
METRIC RATING
68th/ 347
METRIC RANK
8.8%
FAMILY POVERTY
66.3/ 100
METRIC RATING
162nd/ 347
METRIC RANK
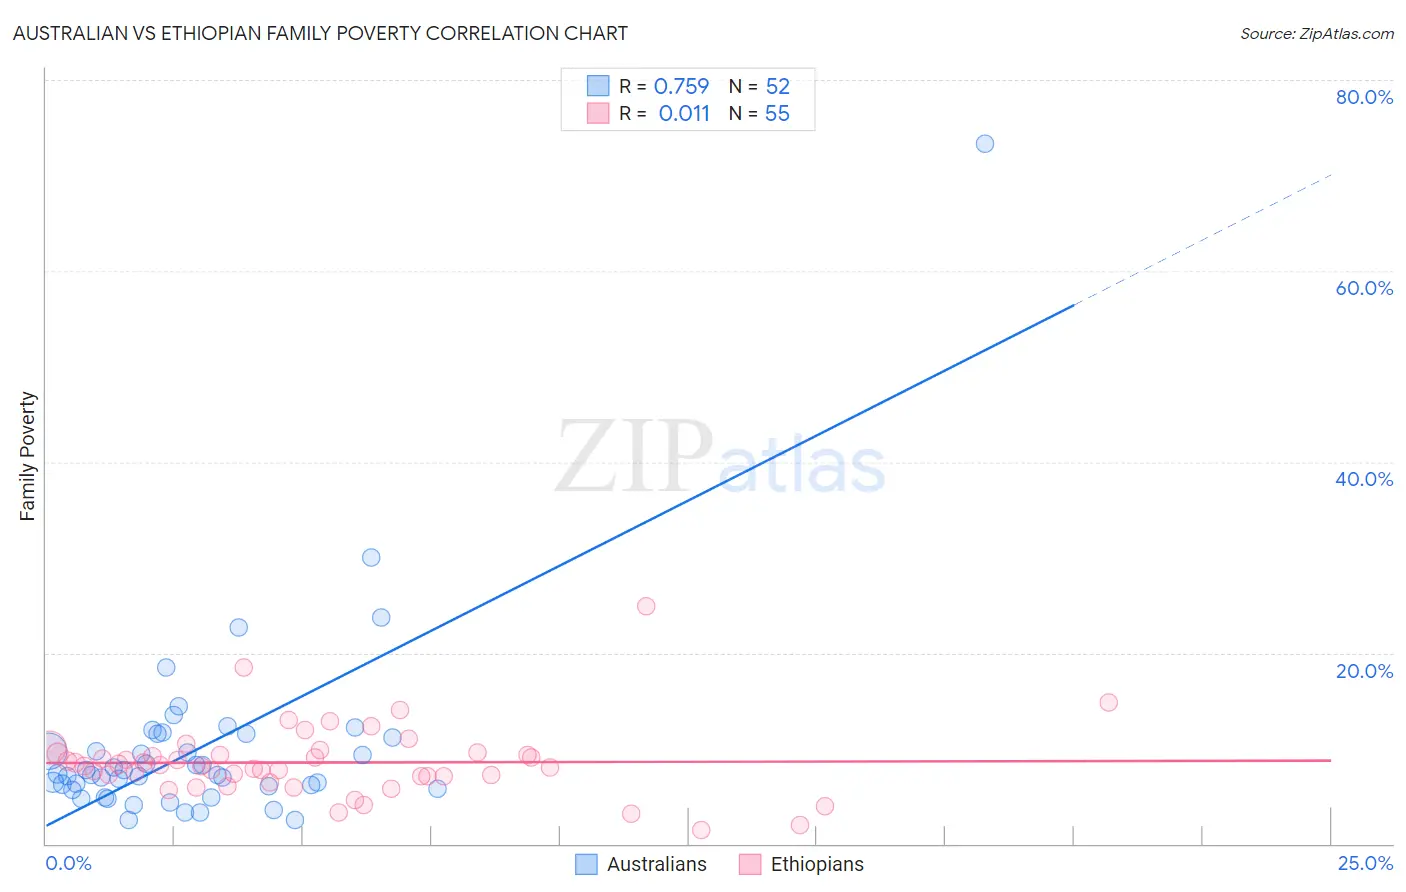
Australian vs Ethiopian Family Poverty Correlation Chart
The statistical analysis conducted on geographies consisting of 223,701,792 people shows a strong positive correlation between the proportion of Australians and poverty level among families in the United States with a correlation coefficient (R) of 0.759 and weighted average of 7.8%. Similarly, the statistical analysis conducted on geographies consisting of 222,923,037 people shows no correlation between the proportion of Ethiopians and poverty level among families in the United States with a correlation coefficient (R) of 0.011 and weighted average of 8.8%, a difference of 12.6%.
Family Poverty Correlation Summary
| Measurement | Australian | Ethiopian |
| Minimum | 2.4% | 1.4% |
| Maximum | 73.3% | 24.9% |
| Range | 70.9% | 23.5% |
| Mean | 10.0% | 8.5% |
| Median | 7.3% | 8.2% |
| Interquartile 25% (IQ1) | 5.9% | 7.1% |
| Interquartile 75% (IQ3) | 11.3% | 9.4% |
| Interquartile Range (IQR) | 5.5% | 2.3% |
| Standard Deviation (Sample) | 10.4% | 3.8% |
| Standard Deviation (Population) | 10.3% | 3.8% |
Similar Demographics by Family Poverty
Demographics Similar to Australians by Family Poverty
In terms of family poverty, the demographic groups most similar to Australians are Immigrants from Belgium (7.8%, a difference of 0.010%), Northern European (7.8%, a difference of 0.030%), Dutch (7.8%, a difference of 0.040%), Immigrants from Canada (7.8%, a difference of 0.060%), and Cambodian (7.8%, a difference of 0.070%).
| Demographics | Rating | Rank | Family Poverty |
| Immigrants | Netherlands | 98.6 /100 | #61 | Exceptional 7.7% |
| Macedonians | 98.6 /100 | #62 | Exceptional 7.8% |
| Zimbabweans | 98.4 /100 | #63 | Exceptional 7.8% |
| Koreans | 98.3 /100 | #64 | Exceptional 7.8% |
| Immigrants | Bulgaria | 98.3 /100 | #65 | Exceptional 7.8% |
| Dutch | 98.3 /100 | #66 | Exceptional 7.8% |
| Northern Europeans | 98.3 /100 | #67 | Exceptional 7.8% |
| Australians | 98.2 /100 | #68 | Exceptional 7.8% |
| Immigrants | Belgium | 98.2 /100 | #69 | Exceptional 7.8% |
| Immigrants | Canada | 98.2 /100 | #70 | Exceptional 7.8% |
| Cambodians | 98.2 /100 | #71 | Exceptional 7.8% |
| Immigrants | Romania | 98.2 /100 | #72 | Exceptional 7.8% |
| Austrians | 98.2 /100 | #73 | Exceptional 7.8% |
| Immigrants | China | 98.1 /100 | #74 | Exceptional 7.8% |
| Immigrants | Croatia | 98.1 /100 | #75 | Exceptional 7.8% |
Demographics Similar to Ethiopians by Family Poverty
In terms of family poverty, the demographic groups most similar to Ethiopians are Pennsylvania German (8.8%, a difference of 0.050%), Immigrants from Northern Africa (8.8%, a difference of 0.090%), Hungarian (8.8%, a difference of 0.13%), Celtic (8.8%, a difference of 0.21%), and Guamanian/Chamorro (8.8%, a difference of 0.24%).
| Demographics | Rating | Rank | Family Poverty |
| Immigrants | Kuwait | 73.6 /100 | #155 | Good 8.7% |
| Immigrants | Oceania | 71.2 /100 | #156 | Good 8.7% |
| Tsimshian | 69.3 /100 | #157 | Good 8.8% |
| Whites/Caucasians | 69.1 /100 | #158 | Good 8.8% |
| Peruvians | 68.0 /100 | #159 | Good 8.8% |
| Hungarians | 67.2 /100 | #160 | Good 8.8% |
| Immigrants | Northern Africa | 66.9 /100 | #161 | Good 8.8% |
| Ethiopians | 66.3 /100 | #162 | Good 8.8% |
| Pennsylvania Germans | 66.0 /100 | #163 | Good 8.8% |
| Celtics | 64.9 /100 | #164 | Good 8.8% |
| Guamanians/Chamorros | 64.7 /100 | #165 | Good 8.8% |
| Afghans | 63.5 /100 | #166 | Good 8.8% |
| Immigrants | Ethiopia | 62.5 /100 | #167 | Good 8.9% |
| Israelis | 62.1 /100 | #168 | Good 8.9% |
| Immigrants | Chile | 59.6 /100 | #169 | Average 8.9% |