Arapaho vs Ethiopian Family Poverty
COMPARE
Arapaho
Ethiopian
Family Poverty
Family Poverty Comparison
Arapaho
Ethiopians
12.7%
FAMILY POVERTY
0.0/ 100
METRIC RATING
321st/ 347
METRIC RANK
8.8%
FAMILY POVERTY
66.3/ 100
METRIC RATING
162nd/ 347
METRIC RANK
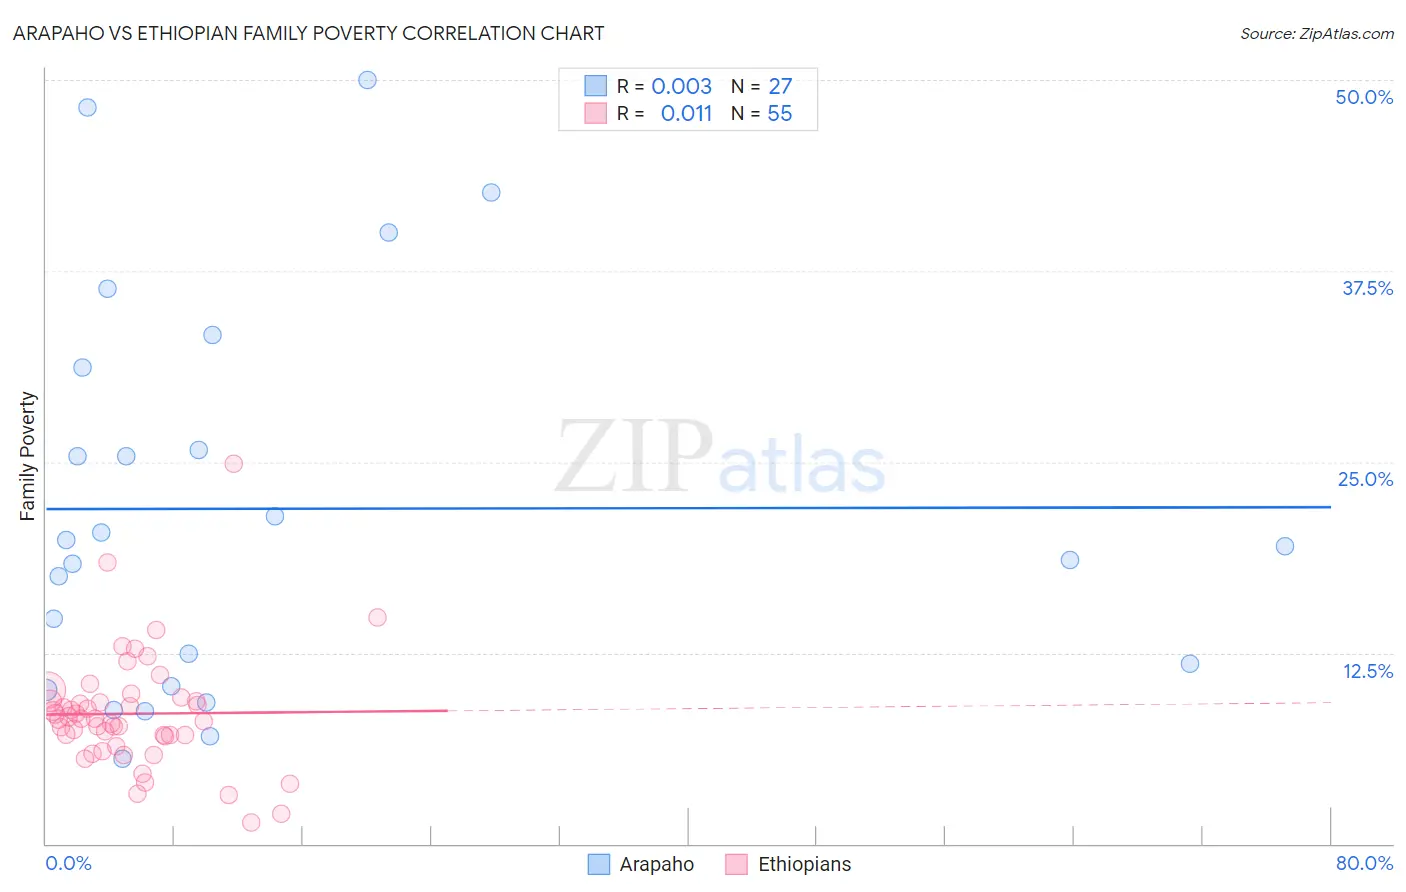
Arapaho vs Ethiopian Family Poverty Correlation Chart
The statistical analysis conducted on geographies consisting of 29,764,504 people shows no correlation between the proportion of Arapaho and poverty level among families in the United States with a correlation coefficient (R) of 0.003 and weighted average of 12.7%. Similarly, the statistical analysis conducted on geographies consisting of 222,923,037 people shows no correlation between the proportion of Ethiopians and poverty level among families in the United States with a correlation coefficient (R) of 0.011 and weighted average of 8.8%, a difference of 43.7%.
Family Poverty Correlation Summary
| Measurement | Arapaho | Ethiopian |
| Minimum | 5.6% | 1.4% |
| Maximum | 50.0% | 24.9% |
| Range | 44.4% | 23.5% |
| Mean | 21.9% | 8.5% |
| Median | 19.5% | 8.2% |
| Interquartile 25% (IQ1) | 10.3% | 7.1% |
| Interquartile 75% (IQ3) | 31.2% | 9.4% |
| Interquartile Range (IQR) | 20.8% | 2.3% |
| Standard Deviation (Sample) | 12.8% | 3.8% |
| Standard Deviation (Population) | 12.6% | 3.8% |
Similar Demographics by Family Poverty
Demographics Similar to Arapaho by Family Poverty
In terms of family poverty, the demographic groups most similar to Arapaho are Immigrants from Honduras (12.7%, a difference of 0.10%), Menominee (12.7%, a difference of 0.65%), Immigrants from Dominica (12.7%, a difference of 0.72%), Inupiat (12.5%, a difference of 1.5%), and British West Indian (12.4%, a difference of 2.0%).
| Demographics | Rating | Rank | Family Poverty |
| Kiowa | 0.0 /100 | #314 | Tragic 12.2% |
| Immigrants | Mexico | 0.0 /100 | #315 | Tragic 12.3% |
| Hondurans | 0.0 /100 | #316 | Tragic 12.4% |
| Immigrants | Grenada | 0.0 /100 | #317 | Tragic 12.4% |
| U.S. Virgin Islanders | 0.0 /100 | #318 | Tragic 12.4% |
| British West Indians | 0.0 /100 | #319 | Tragic 12.4% |
| Inupiat | 0.0 /100 | #320 | Tragic 12.5% |
| Arapaho | 0.0 /100 | #321 | Tragic 12.7% |
| Immigrants | Honduras | 0.0 /100 | #322 | Tragic 12.7% |
| Menominee | 0.0 /100 | #323 | Tragic 12.7% |
| Immigrants | Dominica | 0.0 /100 | #324 | Tragic 12.7% |
| Paiute | 0.0 /100 | #325 | Tragic 13.0% |
| Colville | 0.0 /100 | #326 | Tragic 13.0% |
| Yakama | 0.0 /100 | #327 | Tragic 13.1% |
| Central American Indians | 0.0 /100 | #328 | Tragic 13.3% |
Demographics Similar to Ethiopians by Family Poverty
In terms of family poverty, the demographic groups most similar to Ethiopians are Pennsylvania German (8.8%, a difference of 0.050%), Immigrants from Northern Africa (8.8%, a difference of 0.090%), Hungarian (8.8%, a difference of 0.13%), Celtic (8.8%, a difference of 0.21%), and Guamanian/Chamorro (8.8%, a difference of 0.24%).
| Demographics | Rating | Rank | Family Poverty |
| Immigrants | Kuwait | 73.6 /100 | #155 | Good 8.7% |
| Immigrants | Oceania | 71.2 /100 | #156 | Good 8.7% |
| Tsimshian | 69.3 /100 | #157 | Good 8.8% |
| Whites/Caucasians | 69.1 /100 | #158 | Good 8.8% |
| Peruvians | 68.0 /100 | #159 | Good 8.8% |
| Hungarians | 67.2 /100 | #160 | Good 8.8% |
| Immigrants | Northern Africa | 66.9 /100 | #161 | Good 8.8% |
| Ethiopians | 66.3 /100 | #162 | Good 8.8% |
| Pennsylvania Germans | 66.0 /100 | #163 | Good 8.8% |
| Celtics | 64.9 /100 | #164 | Good 8.8% |
| Guamanians/Chamorros | 64.7 /100 | #165 | Good 8.8% |
| Afghans | 63.5 /100 | #166 | Good 8.8% |
| Immigrants | Ethiopia | 62.5 /100 | #167 | Good 8.9% |
| Israelis | 62.1 /100 | #168 | Good 8.9% |
| Immigrants | Chile | 59.6 /100 | #169 | Average 8.9% |