Afghan vs Immigrants from Vietnam Single Male Poverty
COMPARE
Afghan
Immigrants from Vietnam
Single Male Poverty
Single Male Poverty Comparison
Afghans
Immigrants from Vietnam
10.7%
SINGLE MALE POVERTY
100.0/ 100
METRIC RATING
7th/ 347
METRIC RANK
11.4%
SINGLE MALE POVERTY
100.0/ 100
METRIC RATING
33rd/ 347
METRIC RANK
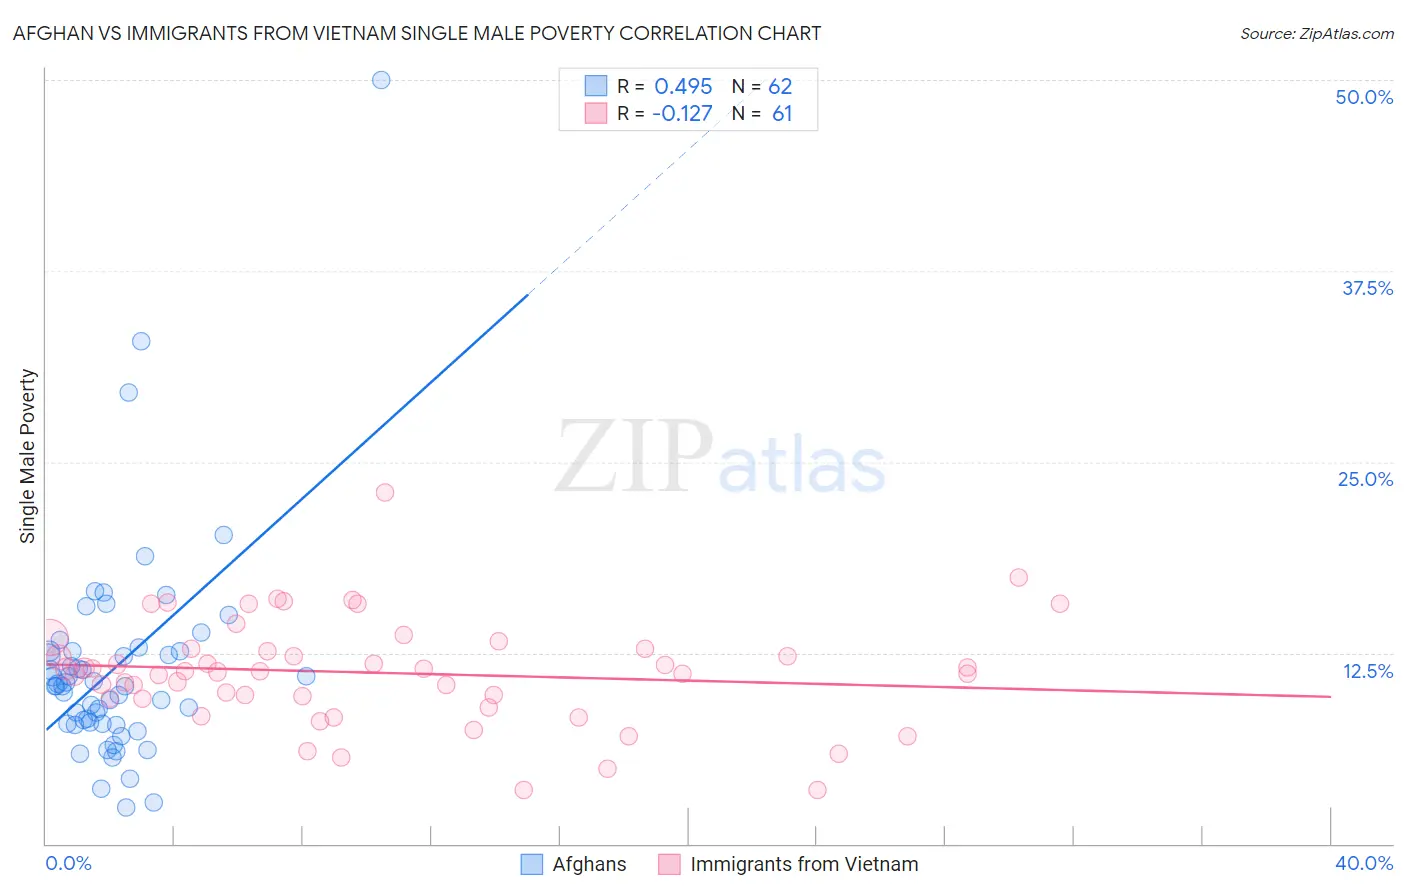
Afghan vs Immigrants from Vietnam Single Male Poverty Correlation Chart
The statistical analysis conducted on geographies consisting of 140,679,200 people shows a moderate positive correlation between the proportion of Afghans and poverty level among single males in the United States with a correlation coefficient (R) of 0.495 and weighted average of 10.7%. Similarly, the statistical analysis conducted on geographies consisting of 361,378,073 people shows a poor negative correlation between the proportion of Immigrants from Vietnam and poverty level among single males in the United States with a correlation coefficient (R) of -0.127 and weighted average of 11.4%, a difference of 6.8%.
Single Male Poverty Correlation Summary
| Measurement | Afghan | Immigrants from Vietnam |
| Minimum | 2.4% | 3.5% |
| Maximum | 50.0% | 23.0% |
| Range | 47.6% | 19.5% |
| Mean | 11.5% | 11.2% |
| Median | 10.3% | 11.3% |
| Interquartile 25% (IQ1) | 7.8% | 9.5% |
| Interquartile 75% (IQ3) | 12.6% | 12.8% |
| Interquartile Range (IQR) | 4.8% | 3.3% |
| Standard Deviation (Sample) | 7.2% | 3.5% |
| Standard Deviation (Population) | 7.2% | 3.5% |
Similar Demographics by Single Male Poverty
Demographics Similar to Afghans by Single Male Poverty
In terms of single male poverty, the demographic groups most similar to Afghans are Thai (10.8%, a difference of 0.47%), Filipino (10.6%, a difference of 0.75%), Taiwanese (10.9%, a difference of 1.7%), Immigrants from Fiji (10.9%, a difference of 1.8%), and Immigrants from Philippines (10.9%, a difference of 1.8%).
| Demographics | Rating | Rank | Single Male Poverty |
| Assyrians/Chaldeans/Syriacs | 100.0 /100 | #1 | Exceptional 9.8% |
| Immigrants | Taiwan | 100.0 /100 | #2 | Exceptional 10.3% |
| Immigrants | India | 100.0 /100 | #3 | Exceptional 10.3% |
| Immigrants | Hong Kong | 100.0 /100 | #4 | Exceptional 10.4% |
| Tongans | 100.0 /100 | #5 | Exceptional 10.5% |
| Filipinos | 100.0 /100 | #6 | Exceptional 10.6% |
| Afghans | 100.0 /100 | #7 | Exceptional 10.7% |
| Thais | 100.0 /100 | #8 | Exceptional 10.8% |
| Taiwanese | 100.0 /100 | #9 | Exceptional 10.9% |
| Immigrants | Fiji | 100.0 /100 | #10 | Exceptional 10.9% |
| Immigrants | Philippines | 100.0 /100 | #11 | Exceptional 10.9% |
| Immigrants | Afghanistan | 100.0 /100 | #12 | Exceptional 10.9% |
| Immigrants | South Central Asia | 100.0 /100 | #13 | Exceptional 10.9% |
| Chinese | 100.0 /100 | #14 | Exceptional 11.0% |
| Koreans | 100.0 /100 | #15 | Exceptional 11.0% |
Demographics Similar to Immigrants from Vietnam by Single Male Poverty
In terms of single male poverty, the demographic groups most similar to Immigrants from Vietnam are Immigrants from Ethiopia (11.4%, a difference of 0.040%), Immigrants from Eastern Asia (11.4%, a difference of 0.070%), Immigrants from South Eastern Asia (11.4%, a difference of 0.080%), Immigrants from Serbia (11.4%, a difference of 0.11%), and Immigrants from Iran (11.4%, a difference of 0.16%).
| Demographics | Rating | Rank | Single Male Poverty |
| Immigrants | Japan | 100.0 /100 | #26 | Exceptional 11.3% |
| Immigrants | China | 100.0 /100 | #27 | Exceptional 11.4% |
| Immigrants | Asia | 100.0 /100 | #28 | Exceptional 11.4% |
| Immigrants | Egypt | 100.0 /100 | #29 | Exceptional 11.4% |
| Iranians | 100.0 /100 | #30 | Exceptional 11.4% |
| Immigrants | Iran | 100.0 /100 | #31 | Exceptional 11.4% |
| Immigrants | Eastern Asia | 100.0 /100 | #32 | Exceptional 11.4% |
| Immigrants | Vietnam | 100.0 /100 | #33 | Exceptional 11.4% |
| Immigrants | Ethiopia | 100.0 /100 | #34 | Exceptional 11.4% |
| Immigrants | South Eastern Asia | 100.0 /100 | #35 | Exceptional 11.4% |
| Immigrants | Serbia | 100.0 /100 | #36 | Exceptional 11.4% |
| Immigrants | Singapore | 100.0 /100 | #37 | Exceptional 11.4% |
| Sri Lankans | 100.0 /100 | #38 | Exceptional 11.5% |
| Soviet Union | 100.0 /100 | #39 | Exceptional 11.5% |
| Immigrants | Korea | 100.0 /100 | #40 | Exceptional 11.5% |