Korean vs Immigrants from Vietnam Doctorate Degree
COMPARE
Korean
Immigrants from Vietnam
Doctorate Degree
Doctorate Degree Comparison
Koreans
Immigrants from Vietnam
1.7%
DOCTORATE DEGREE
14.2/ 100
METRIC RATING
213th/ 347
METRIC RANK
1.8%
DOCTORATE DEGREE
21.4/ 100
METRIC RATING
203rd/ 347
METRIC RANK
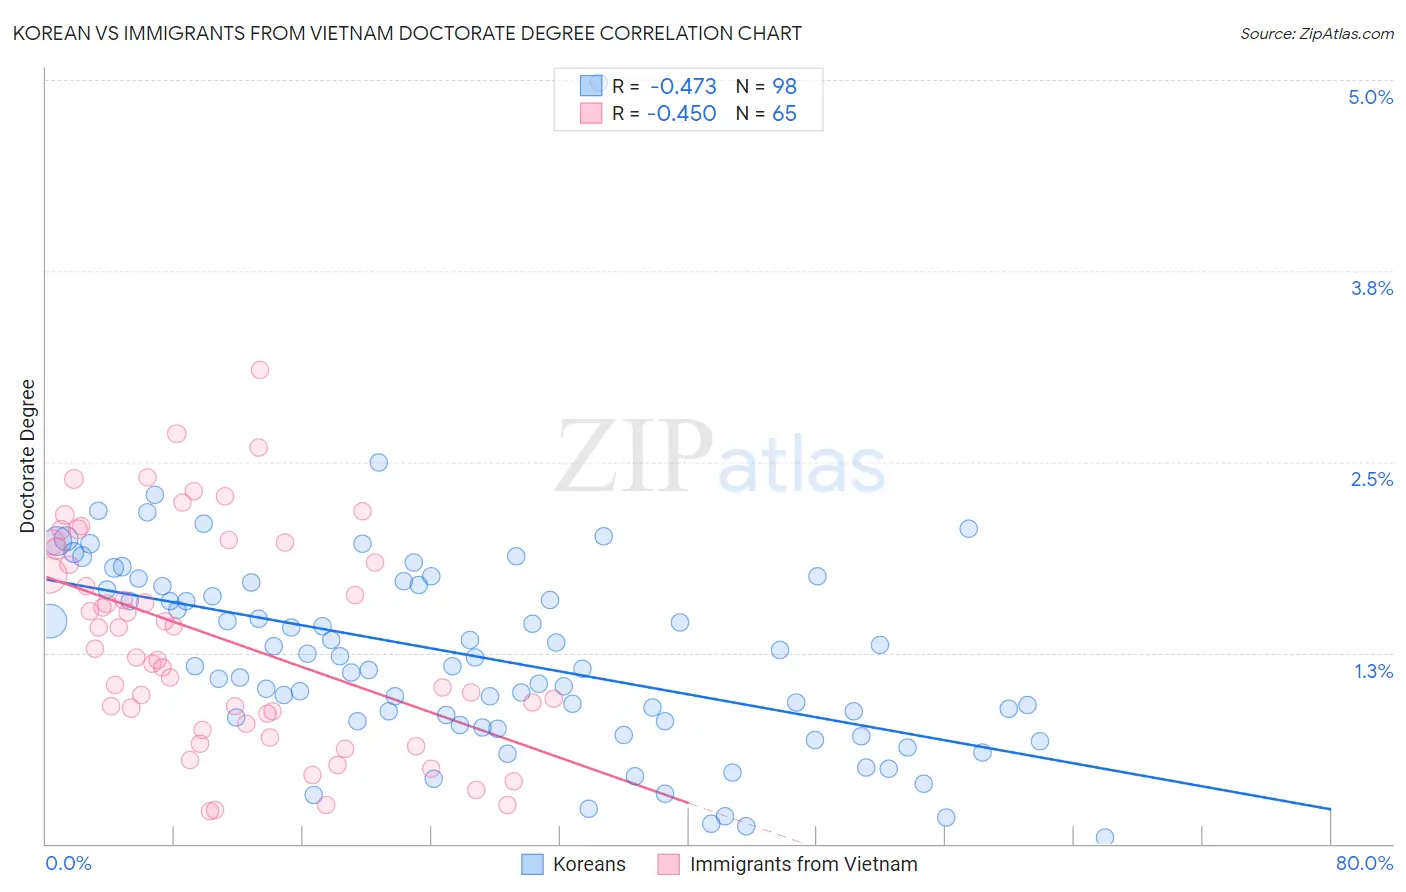
Korean vs Immigrants from Vietnam Doctorate Degree Correlation Chart
The statistical analysis conducted on geographies consisting of 500,370,759 people shows a moderate negative correlation between the proportion of Koreans and percentage of population with at least doctorate degree education in the United States with a correlation coefficient (R) of -0.473 and weighted average of 1.7%. Similarly, the statistical analysis conducted on geographies consisting of 401,213,179 people shows a moderate negative correlation between the proportion of Immigrants from Vietnam and percentage of population with at least doctorate degree education in the United States with a correlation coefficient (R) of -0.450 and weighted average of 1.8%, a difference of 1.9%.
Doctorate Degree Correlation Summary
| Measurement | Korean | Immigrants from Vietnam |
| Minimum | 0.043% | 0.22% |
| Maximum | 5.0% | 3.1% |
| Range | 4.9% | 2.9% |
| Mean | 1.2% | 1.3% |
| Median | 1.2% | 1.3% |
| Interquartile 25% (IQ1) | 0.80% | 0.82% |
| Interquartile 75% (IQ3) | 1.7% | 2.0% |
| Interquartile Range (IQR) | 0.88% | 1.1% |
| Standard Deviation (Sample) | 0.69% | 0.70% |
| Standard Deviation (Population) | 0.68% | 0.69% |
Demographics Similar to Koreans and Immigrants from Vietnam by Doctorate Degree
In terms of doctorate degree, the demographic groups most similar to Koreans are Pueblo (1.7%, a difference of 0.010%), Immigrants from South Eastern Asia (1.7%, a difference of 0.15%), Alaskan Athabascan (1.7%, a difference of 0.15%), Immigrants from Burma/Myanmar (1.7%, a difference of 0.25%), and Immigrants from Armenia (1.7%, a difference of 0.27%). Similarly, the demographic groups most similar to Immigrants from Vietnam are Portuguese (1.8%, a difference of 0.020%), Somali (1.7%, a difference of 0.030%), Immigrants from Nigeria (1.8%, a difference of 0.25%), White/Caucasian (1.8%, a difference of 0.32%), and Immigrants from South America (1.8%, a difference of 0.43%).
| Demographics | Rating | Rank | Doctorate Degree |
| Immigrants | Ghana | 24.6 /100 | #198 | Fair 1.8% |
| Immigrants | South America | 23.3 /100 | #199 | Fair 1.8% |
| Whites/Caucasians | 22.8 /100 | #200 | Fair 1.8% |
| Immigrants | Nigeria | 22.4 /100 | #201 | Fair 1.8% |
| Portuguese | 21.4 /100 | #202 | Fair 1.8% |
| Immigrants | Vietnam | 21.4 /100 | #203 | Fair 1.8% |
| Somalis | 21.2 /100 | #204 | Fair 1.7% |
| Venezuelans | 19.5 /100 | #205 | Poor 1.7% |
| Immigrants | Peru | 17.6 /100 | #206 | Poor 1.7% |
| Yugoslavians | 17.1 /100 | #207 | Poor 1.7% |
| Colombians | 16.1 /100 | #208 | Poor 1.7% |
| Immigrants | Western Africa | 15.4 /100 | #209 | Poor 1.7% |
| Tongans | 15.1 /100 | #210 | Poor 1.7% |
| Immigrants | Armenia | 15.1 /100 | #211 | Poor 1.7% |
| Immigrants | South Eastern Asia | 14.7 /100 | #212 | Poor 1.7% |
| Koreans | 14.2 /100 | #213 | Poor 1.7% |
| Pueblo | 14.2 /100 | #214 | Poor 1.7% |
| Alaskan Athabascans | 13.8 /100 | #215 | Poor 1.7% |
| Immigrants | Burma/Myanmar | 13.5 /100 | #216 | Poor 1.7% |
| Spanish Americans | 12.9 /100 | #217 | Poor 1.7% |
| Tlingit-Haida | 11.9 /100 | #218 | Poor 1.7% |