Korean vs Immigrants from Vietnam Single Mother Poverty
COMPARE
Korean
Immigrants from Vietnam
Single Mother Poverty
Single Mother Poverty Comparison
Koreans
Immigrants from Vietnam
26.4%
SINGLE MOTHER POVERTY
100.0/ 100
METRIC RATING
28th/ 347
METRIC RANK
26.7%
SINGLE MOTHER POVERTY
99.9/ 100
METRIC RATING
40th/ 347
METRIC RANK
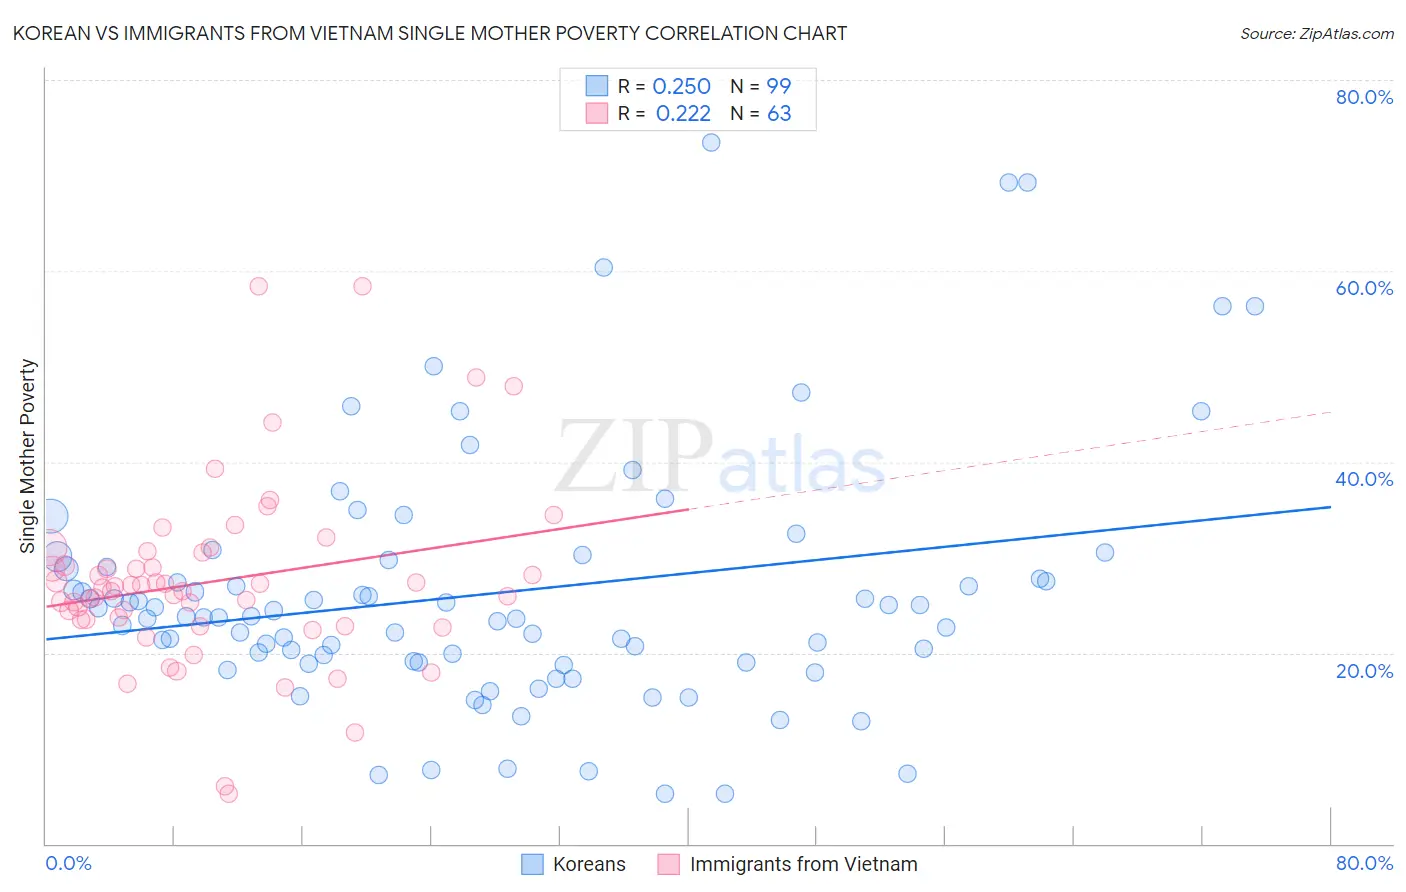
Korean vs Immigrants from Vietnam Single Mother Poverty Correlation Chart
The statistical analysis conducted on geographies consisting of 493,220,076 people shows a weak positive correlation between the proportion of Koreans and poverty level among single mothers in the United States with a correlation coefficient (R) of 0.250 and weighted average of 26.4%. Similarly, the statistical analysis conducted on geographies consisting of 395,889,190 people shows a weak positive correlation between the proportion of Immigrants from Vietnam and poverty level among single mothers in the United States with a correlation coefficient (R) of 0.222 and weighted average of 26.7%, a difference of 1.2%.
Single Mother Poverty Correlation Summary
| Measurement | Korean | Immigrants from Vietnam |
| Minimum | 5.2% | 5.2% |
| Maximum | 73.4% | 58.3% |
| Range | 68.2% | 53.1% |
| Mean | 26.2% | 27.5% |
| Median | 23.8% | 26.8% |
| Interquartile 25% (IQ1) | 19.0% | 23.5% |
| Interquartile 75% (IQ3) | 29.0% | 30.5% |
| Interquartile Range (IQR) | 10.0% | 7.0% |
| Standard Deviation (Sample) | 13.2% | 9.5% |
| Standard Deviation (Population) | 13.1% | 9.4% |
Demographics Similar to Koreans and Immigrants from Vietnam by Single Mother Poverty
In terms of single mother poverty, the demographic groups most similar to Koreans are Immigrants from Japan (26.4%, a difference of 0.010%), Jordanian (26.4%, a difference of 0.050%), Turkish (26.4%, a difference of 0.14%), Immigrants from Sri Lanka (26.3%, a difference of 0.24%), and Immigrants from Philippines (26.5%, a difference of 0.30%). Similarly, the demographic groups most similar to Immigrants from Vietnam are Immigrants from Greece (26.7%, a difference of 0.070%), Sri Lankan (26.7%, a difference of 0.090%), Armenian (26.8%, a difference of 0.31%), Tsimshian (26.8%, a difference of 0.39%), and Immigrants from Fiji (26.6%, a difference of 0.43%).
| Demographics | Rating | Rank | Single Mother Poverty |
| Immigrants | Moldova | 100.0 /100 | #24 | Exceptional 26.2% |
| Immigrants | Asia | 100.0 /100 | #25 | Exceptional 26.3% |
| Immigrants | Sri Lanka | 100.0 /100 | #26 | Exceptional 26.3% |
| Immigrants | Japan | 100.0 /100 | #27 | Exceptional 26.4% |
| Koreans | 100.0 /100 | #28 | Exceptional 26.4% |
| Jordanians | 100.0 /100 | #29 | Exceptional 26.4% |
| Turks | 100.0 /100 | #30 | Exceptional 26.4% |
| Immigrants | Philippines | 100.0 /100 | #31 | Exceptional 26.5% |
| Tongans | 99.9 /100 | #32 | Exceptional 26.5% |
| Bulgarians | 99.9 /100 | #33 | Exceptional 26.5% |
| Immigrants | Indonesia | 99.9 /100 | #34 | Exceptional 26.6% |
| Maltese | 99.9 /100 | #35 | Exceptional 26.6% |
| Okinawans | 99.9 /100 | #36 | Exceptional 26.6% |
| Immigrants | Israel | 99.9 /100 | #37 | Exceptional 26.6% |
| Immigrants | Fiji | 99.9 /100 | #38 | Exceptional 26.6% |
| Sri Lankans | 99.9 /100 | #39 | Exceptional 26.7% |
| Immigrants | Vietnam | 99.9 /100 | #40 | Exceptional 26.7% |
| Immigrants | Greece | 99.9 /100 | #41 | Exceptional 26.7% |
| Armenians | 99.9 /100 | #42 | Exceptional 26.8% |
| Tsimshian | 99.9 /100 | #43 | Exceptional 26.8% |
| Immigrants | Sierra Leone | 99.9 /100 | #44 | Exceptional 26.9% |