Samoan vs Immigrants from Vietnam Single Male Poverty
COMPARE
Samoan
Immigrants from Vietnam
Single Male Poverty
Single Male Poverty Comparison
Samoans
Immigrants from Vietnam
11.7%
SINGLE MALE POVERTY
99.9/ 100
METRIC RATING
52nd/ 347
METRIC RANK
11.4%
SINGLE MALE POVERTY
100.0/ 100
METRIC RATING
33rd/ 347
METRIC RANK
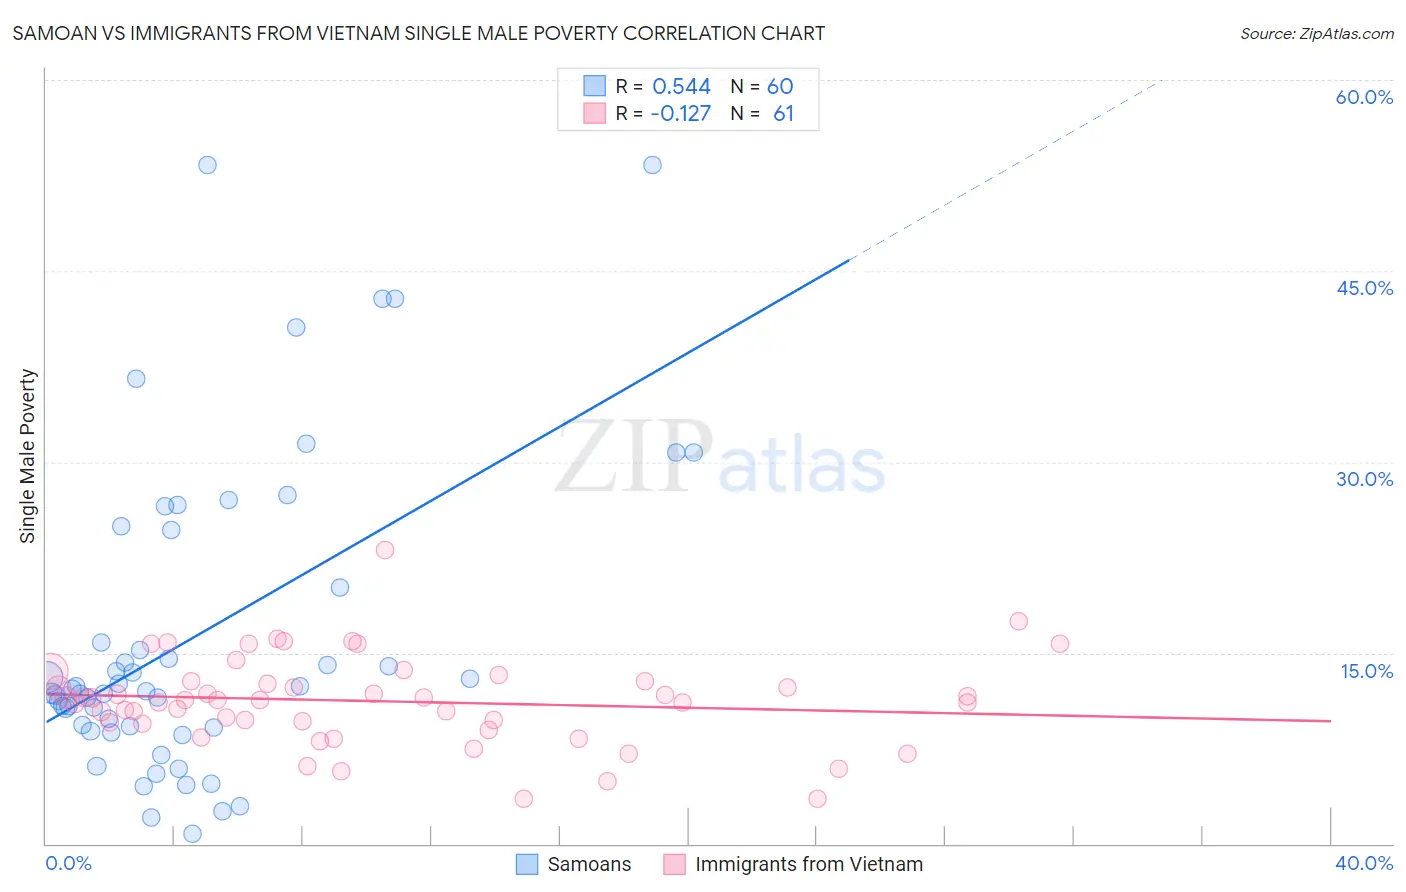
Samoan vs Immigrants from Vietnam Single Male Poverty Correlation Chart
The statistical analysis conducted on geographies consisting of 211,659,255 people shows a substantial positive correlation between the proportion of Samoans and poverty level among single males in the United States with a correlation coefficient (R) of 0.544 and weighted average of 11.7%. Similarly, the statistical analysis conducted on geographies consisting of 361,378,073 people shows a poor negative correlation between the proportion of Immigrants from Vietnam and poverty level among single males in the United States with a correlation coefficient (R) of -0.127 and weighted average of 11.4%, a difference of 1.9%.
Single Male Poverty Correlation Summary
| Measurement | Samoan | Immigrants from Vietnam |
| Minimum | 0.75% | 3.5% |
| Maximum | 53.3% | 23.0% |
| Range | 52.6% | 19.5% |
| Mean | 16.3% | 11.2% |
| Median | 12.1% | 11.3% |
| Interquartile 25% (IQ1) | 9.2% | 9.5% |
| Interquartile 75% (IQ3) | 22.4% | 12.8% |
| Interquartile Range (IQR) | 13.2% | 3.3% |
| Standard Deviation (Sample) | 12.2% | 3.5% |
| Standard Deviation (Population) | 12.1% | 3.5% |
Demographics Similar to Samoans and Immigrants from Vietnam by Single Male Poverty
In terms of single male poverty, the demographic groups most similar to Samoans are Paraguayan (11.6%, a difference of 0.31%), Immigrants from Lithuania (11.6%, a difference of 0.42%), Tlingit-Haida (11.6%, a difference of 0.47%), Immigrants from Indonesia (11.6%, a difference of 0.49%), and Nepalese (11.6%, a difference of 0.57%). Similarly, the demographic groups most similar to Immigrants from Vietnam are Immigrants from Ethiopia (11.4%, a difference of 0.040%), Immigrants from Eastern Asia (11.4%, a difference of 0.070%), Immigrants from South Eastern Asia (11.4%, a difference of 0.080%), Immigrants from Serbia (11.4%, a difference of 0.11%), and Immigrants from Singapore (11.4%, a difference of 0.16%).
| Demographics | Rating | Rank | Single Male Poverty |
| Immigrants | Eastern Asia | 100.0 /100 | #32 | Exceptional 11.4% |
| Immigrants | Vietnam | 100.0 /100 | #33 | Exceptional 11.4% |
| Immigrants | Ethiopia | 100.0 /100 | #34 | Exceptional 11.4% |
| Immigrants | South Eastern Asia | 100.0 /100 | #35 | Exceptional 11.4% |
| Immigrants | Serbia | 100.0 /100 | #36 | Exceptional 11.4% |
| Immigrants | Singapore | 100.0 /100 | #37 | Exceptional 11.4% |
| Sri Lankans | 100.0 /100 | #38 | Exceptional 11.5% |
| Soviet Union | 100.0 /100 | #39 | Exceptional 11.5% |
| Immigrants | Korea | 100.0 /100 | #40 | Exceptional 11.5% |
| Immigrants | Iraq | 99.9 /100 | #41 | Exceptional 11.5% |
| Egyptians | 99.9 /100 | #42 | Exceptional 11.5% |
| Immigrants | Peru | 99.9 /100 | #43 | Exceptional 11.5% |
| Immigrants | Cameroon | 99.9 /100 | #44 | Exceptional 11.5% |
| Immigrants | Poland | 99.9 /100 | #45 | Exceptional 11.5% |
| Immigrants | Bulgaria | 99.9 /100 | #46 | Exceptional 11.6% |
| Nepalese | 99.9 /100 | #47 | Exceptional 11.6% |
| Immigrants | Indonesia | 99.9 /100 | #48 | Exceptional 11.6% |
| Tlingit-Haida | 99.9 /100 | #49 | Exceptional 11.6% |
| Immigrants | Lithuania | 99.9 /100 | #50 | Exceptional 11.6% |
| Paraguayans | 99.9 /100 | #51 | Exceptional 11.6% |
| Samoans | 99.9 /100 | #52 | Exceptional 11.7% |