Korean vs Dutch West Indian Professional Degree
COMPARE
Korean
Dutch West Indian
Professional Degree
Professional Degree Comparison
Koreans
Dutch West Indians
4.1%
PROFESSIONAL DEGREE
10.7/ 100
METRIC RATING
213th/ 347
METRIC RANK
3.1%
PROFESSIONAL DEGREE
0.0/ 100
METRIC RATING
327th/ 347
METRIC RANK
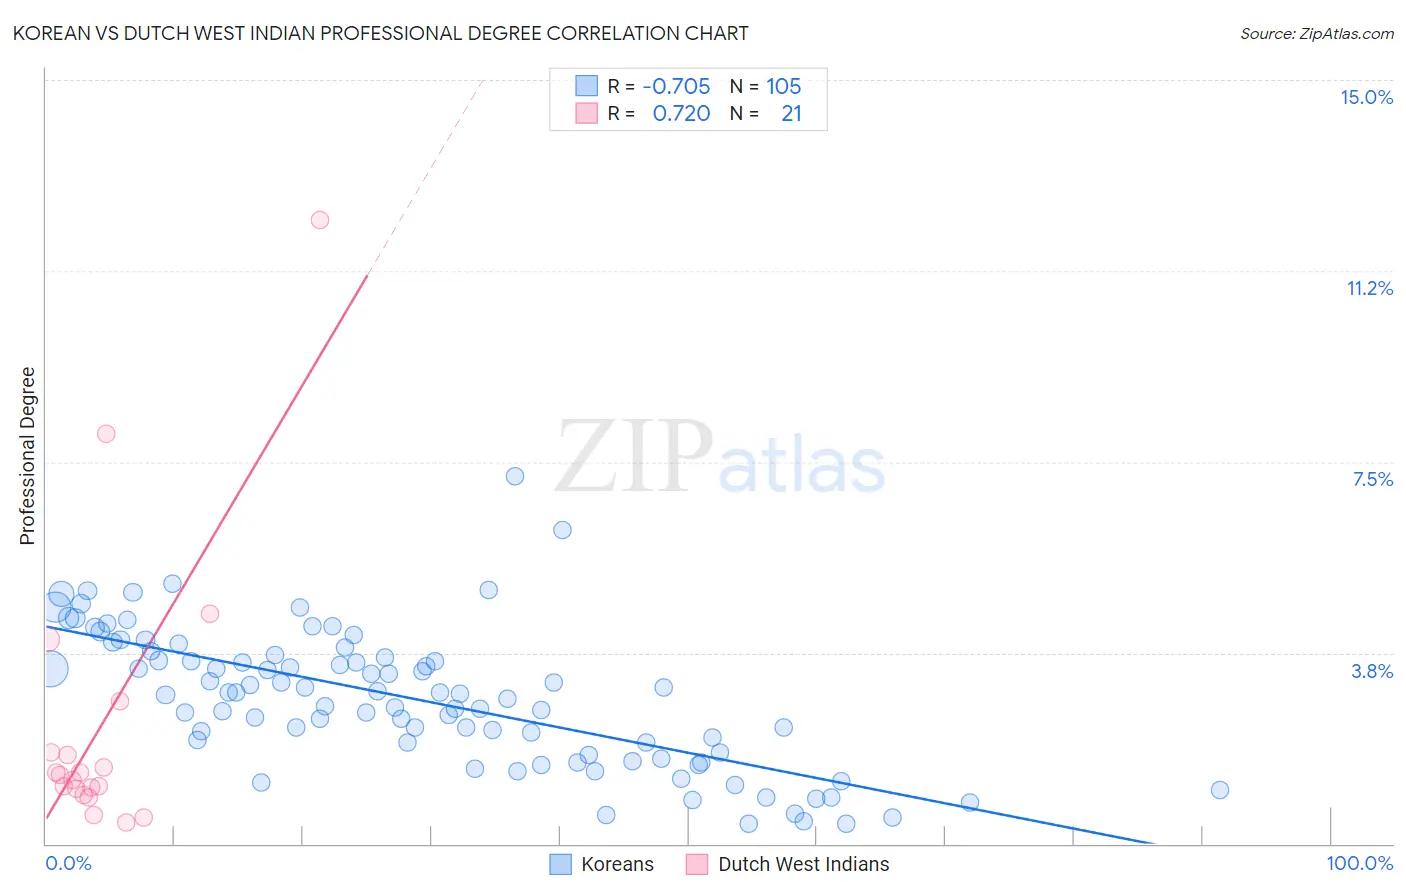
Korean vs Dutch West Indian Professional Degree Correlation Chart
The statistical analysis conducted on geographies consisting of 508,138,227 people shows a strong negative correlation between the proportion of Koreans and percentage of population with at least professional degree education in the United States with a correlation coefficient (R) of -0.705 and weighted average of 4.1%. Similarly, the statistical analysis conducted on geographies consisting of 85,349,686 people shows a strong positive correlation between the proportion of Dutch West Indians and percentage of population with at least professional degree education in the United States with a correlation coefficient (R) of 0.720 and weighted average of 3.1%, a difference of 31.3%.
Professional Degree Correlation Summary
| Measurement | Korean | Dutch West Indian |
| Minimum | 0.39% | 0.42% |
| Maximum | 7.2% | 12.2% |
| Range | 6.8% | 11.8% |
| Mean | 2.8% | 2.4% |
| Median | 2.9% | 1.4% |
| Interquartile 25% (IQ1) | 1.8% | 1.0% |
| Interquartile 75% (IQ3) | 3.7% | 2.3% |
| Interquartile Range (IQR) | 1.9% | 1.3% |
| Standard Deviation (Sample) | 1.3% | 2.9% |
| Standard Deviation (Population) | 1.3% | 2.8% |
Similar Demographics by Professional Degree
Demographics Similar to Koreans by Professional Degree
In terms of professional degree, the demographic groups most similar to Koreans are Immigrants from Ghana (4.1%, a difference of 0.050%), Portuguese (4.1%, a difference of 0.10%), White/Caucasian (4.1%, a difference of 0.18%), German (4.1%, a difference of 0.36%), and Immigrants from Nigeria (4.1%, a difference of 0.39%).
| Demographics | Rating | Rank | Professional Degree |
| Yugoslavians | 13.4 /100 | #206 | Poor 4.1% |
| Sub-Saharan Africans | 12.8 /100 | #207 | Poor 4.1% |
| Immigrants | Somalia | 12.5 /100 | #208 | Poor 4.1% |
| Immigrants | Panama | 12.3 /100 | #209 | Poor 4.1% |
| Immigrants | Nigeria | 11.7 /100 | #210 | Poor 4.1% |
| Germans | 11.6 /100 | #211 | Poor 4.1% |
| Whites/Caucasians | 11.2 /100 | #212 | Poor 4.1% |
| Koreans | 10.7 /100 | #213 | Poor 4.1% |
| Immigrants | Ghana | 10.6 /100 | #214 | Poor 4.1% |
| Portuguese | 10.5 /100 | #215 | Poor 4.1% |
| West Indians | 9.8 /100 | #216 | Tragic 4.1% |
| Immigrants | Vietnam | 9.4 /100 | #217 | Tragic 4.0% |
| Dutch | 9.0 /100 | #218 | Tragic 4.0% |
| Immigrants | South Eastern Asia | 8.9 /100 | #219 | Tragic 4.0% |
| Ute | 8.2 /100 | #220 | Tragic 4.0% |
Demographics Similar to Dutch West Indians by Professional Degree
In terms of professional degree, the demographic groups most similar to Dutch West Indians are Creek (3.1%, a difference of 0.060%), Menominee (3.1%, a difference of 0.10%), Bangladeshi (3.1%, a difference of 0.27%), Immigrants from Cabo Verde (3.1%, a difference of 0.35%), and Kiowa (3.1%, a difference of 0.47%).
| Demographics | Rating | Rank | Professional Degree |
| Seminole | 0.1 /100 | #320 | Tragic 3.2% |
| Tsimshian | 0.0 /100 | #321 | Tragic 3.2% |
| Hispanics or Latinos | 0.0 /100 | #322 | Tragic 3.2% |
| Inupiat | 0.0 /100 | #323 | Tragic 3.2% |
| Crow | 0.0 /100 | #324 | Tragic 3.2% |
| Yaqui | 0.0 /100 | #325 | Tragic 3.2% |
| Menominee | 0.0 /100 | #326 | Tragic 3.1% |
| Dutch West Indians | 0.0 /100 | #327 | Tragic 3.1% |
| Creek | 0.0 /100 | #328 | Tragic 3.1% |
| Bangladeshis | 0.0 /100 | #329 | Tragic 3.1% |
| Immigrants | Cabo Verde | 0.0 /100 | #330 | Tragic 3.1% |
| Kiowa | 0.0 /100 | #331 | Tragic 3.1% |
| Yakama | 0.0 /100 | #332 | Tragic 3.1% |
| Puget Sound Salish | 0.0 /100 | #333 | Tragic 3.1% |
| Pennsylvania Germans | 0.0 /100 | #334 | Tragic 3.0% |