Paraguayan vs Dutch West Indian Single Male Poverty
COMPARE
Paraguayan
Dutch West Indian
Single Male Poverty
Single Male Poverty Comparison
Paraguayans
Dutch West Indians
11.6%
SINGLE MALE POVERTY
99.9/ 100
METRIC RATING
51st/ 347
METRIC RANK
16.1%
SINGLE MALE POVERTY
0.0/ 100
METRIC RATING
316th/ 347
METRIC RANK
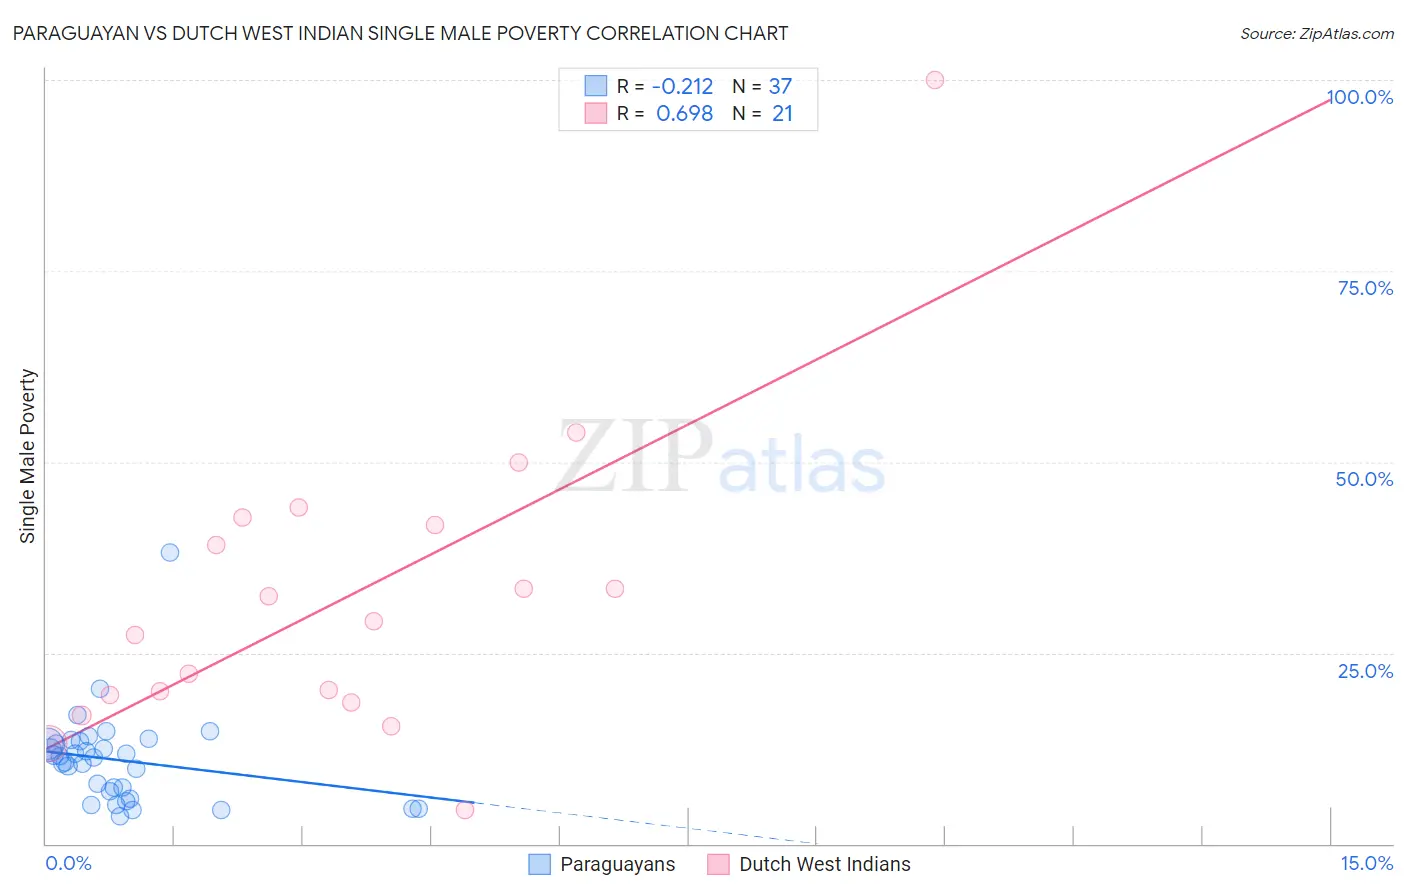
Paraguayan vs Dutch West Indian Single Male Poverty Correlation Chart
The statistical analysis conducted on geographies consisting of 90,716,103 people shows a weak negative correlation between the proportion of Paraguayans and poverty level among single males in the United States with a correlation coefficient (R) of -0.212 and weighted average of 11.6%. Similarly, the statistical analysis conducted on geographies consisting of 82,367,867 people shows a significant positive correlation between the proportion of Dutch West Indians and poverty level among single males in the United States with a correlation coefficient (R) of 0.698 and weighted average of 16.1%, a difference of 38.9%.
Single Male Poverty Correlation Summary
| Measurement | Paraguayan | Dutch West Indian |
| Minimum | 3.6% | 4.5% |
| Maximum | 38.1% | 100.0% |
| Range | 34.5% | 95.5% |
| Mean | 10.9% | 32.3% |
| Median | 11.3% | 29.1% |
| Interquartile 25% (IQ1) | 6.4% | 19.0% |
| Interquartile 75% (IQ3) | 13.2% | 42.3% |
| Interquartile Range (IQR) | 6.8% | 23.3% |
| Standard Deviation (Sample) | 6.1% | 20.2% |
| Standard Deviation (Population) | 6.0% | 19.8% |
Similar Demographics by Single Male Poverty
Demographics Similar to Paraguayans by Single Male Poverty
In terms of single male poverty, the demographic groups most similar to Paraguayans are Immigrants from Lithuania (11.6%, a difference of 0.11%), Tlingit-Haida (11.6%, a difference of 0.17%), Immigrants from Indonesia (11.6%, a difference of 0.19%), Nepalese (11.6%, a difference of 0.26%), and Samoan (11.7%, a difference of 0.31%).
| Demographics | Rating | Rank | Single Male Poverty |
| Immigrants | Cameroon | 99.9 /100 | #44 | Exceptional 11.5% |
| Immigrants | Poland | 99.9 /100 | #45 | Exceptional 11.5% |
| Immigrants | Bulgaria | 99.9 /100 | #46 | Exceptional 11.6% |
| Nepalese | 99.9 /100 | #47 | Exceptional 11.6% |
| Immigrants | Indonesia | 99.9 /100 | #48 | Exceptional 11.6% |
| Tlingit-Haida | 99.9 /100 | #49 | Exceptional 11.6% |
| Immigrants | Lithuania | 99.9 /100 | #50 | Exceptional 11.6% |
| Paraguayans | 99.9 /100 | #51 | Exceptional 11.6% |
| Samoans | 99.9 /100 | #52 | Exceptional 11.7% |
| Bulgarians | 99.9 /100 | #53 | Exceptional 11.7% |
| Immigrants | Uzbekistan | 99.9 /100 | #54 | Exceptional 11.7% |
| Cypriots | 99.9 /100 | #55 | Exceptional 11.7% |
| Burmese | 99.8 /100 | #56 | Exceptional 11.7% |
| Immigrants | Romania | 99.8 /100 | #57 | Exceptional 11.7% |
| Immigrants | Brazil | 99.8 /100 | #58 | Exceptional 11.7% |
Demographics Similar to Dutch West Indians by Single Male Poverty
In terms of single male poverty, the demographic groups most similar to Dutch West Indians are Cheyenne (16.1%, a difference of 0.14%), Alaskan Athabascan (16.1%, a difference of 0.19%), Black/African American (16.2%, a difference of 0.34%), Cherokee (16.1%, a difference of 0.48%), and Seminole (16.0%, a difference of 0.71%).
| Demographics | Rating | Rank | Single Male Poverty |
| Americans | 0.0 /100 | #309 | Tragic 15.8% |
| Yakama | 0.0 /100 | #310 | Tragic 15.9% |
| Seminole | 0.0 /100 | #311 | Tragic 16.0% |
| Comanche | 0.0 /100 | #312 | Tragic 16.0% |
| Cherokee | 0.0 /100 | #313 | Tragic 16.1% |
| Alaskan Athabascans | 0.0 /100 | #314 | Tragic 16.1% |
| Cheyenne | 0.0 /100 | #315 | Tragic 16.1% |
| Dutch West Indians | 0.0 /100 | #316 | Tragic 16.1% |
| Blacks/African Americans | 0.0 /100 | #317 | Tragic 16.2% |
| Chickasaw | 0.0 /100 | #318 | Tragic 16.3% |
| Chippewa | 0.0 /100 | #319 | Tragic 16.4% |
| Marshallese | 0.0 /100 | #320 | Tragic 16.4% |
| Osage | 0.0 /100 | #321 | Tragic 16.5% |
| Shoshone | 0.0 /100 | #322 | Tragic 16.7% |
| Creek | 0.0 /100 | #323 | Tragic 16.8% |