Immigrants from Caribbean vs Syrian Family Poverty
COMPARE
Immigrants from Caribbean
Syrian
Family Poverty
Family Poverty Comparison
Immigrants from Caribbean
Syrians
12.2%
FAMILY POVERTY
0.0/ 100
METRIC RATING
313th/ 347
METRIC RANK
8.6%
FAMILY POVERTY
80.3/ 100
METRIC RATING
150th/ 347
METRIC RANK
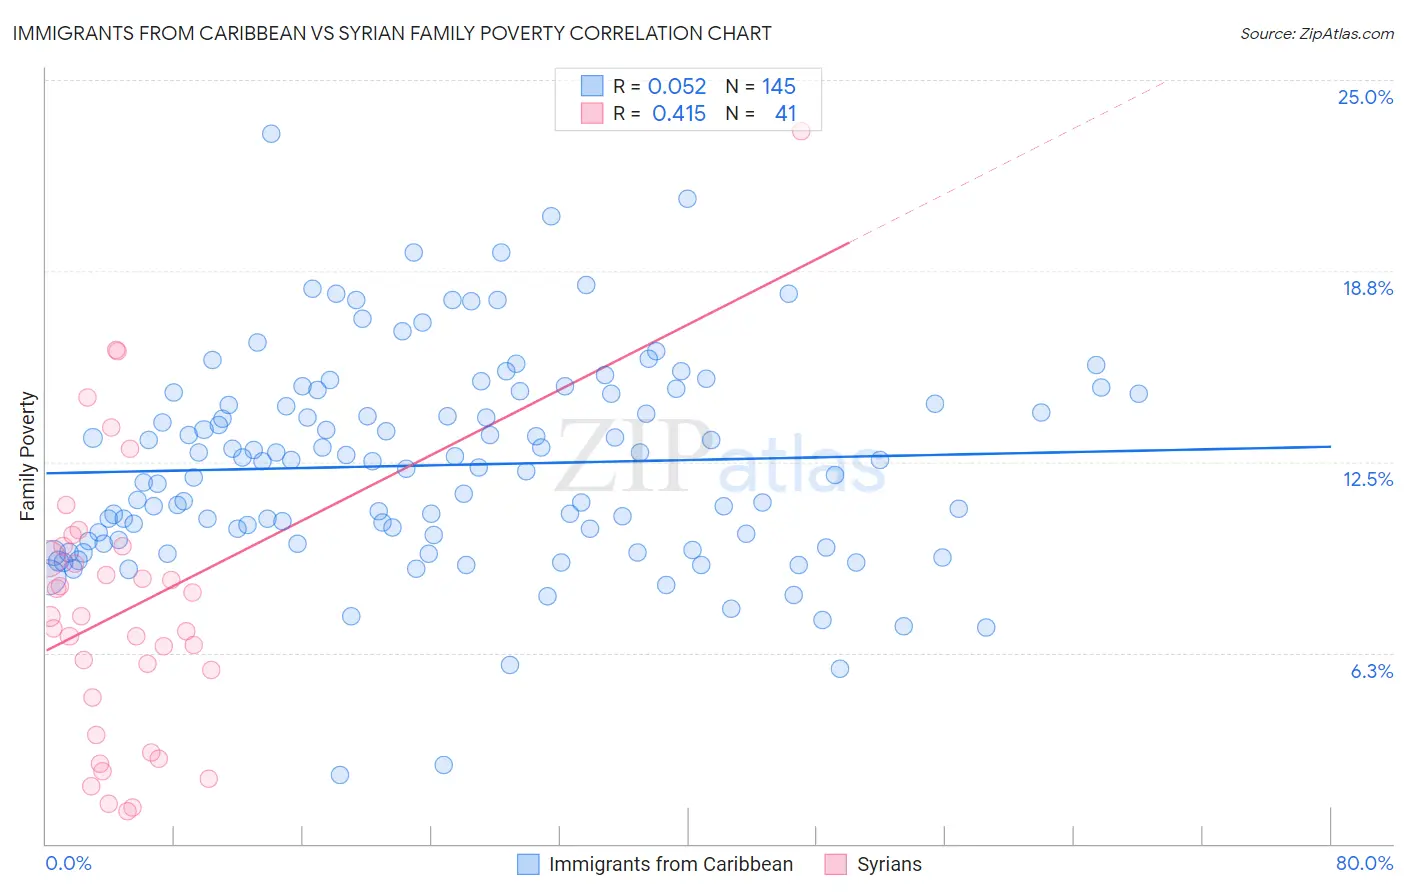
Immigrants from Caribbean vs Syrian Family Poverty Correlation Chart
The statistical analysis conducted on geographies consisting of 448,312,225 people shows a slight positive correlation between the proportion of Immigrants from Caribbean and poverty level among families in the United States with a correlation coefficient (R) of 0.052 and weighted average of 12.2%. Similarly, the statistical analysis conducted on geographies consisting of 265,791,569 people shows a moderate positive correlation between the proportion of Syrians and poverty level among families in the United States with a correlation coefficient (R) of 0.415 and weighted average of 8.6%, a difference of 41.8%.
Family Poverty Correlation Summary
| Measurement | Immigrants from Caribbean | Syrian |
| Minimum | 2.2% | 1.1% |
| Maximum | 23.2% | 23.3% |
| Range | 21.0% | 22.3% |
| Mean | 12.4% | 7.7% |
| Median | 12.5% | 7.4% |
| Interquartile 25% (IQ1) | 9.9% | 4.2% |
| Interquartile 75% (IQ3) | 14.7% | 9.7% |
| Interquartile Range (IQR) | 4.8% | 5.6% |
| Standard Deviation (Sample) | 3.4% | 4.7% |
| Standard Deviation (Population) | 3.4% | 4.6% |
Similar Demographics by Family Poverty
Demographics Similar to Immigrants from Caribbean by Family Poverty
In terms of family poverty, the demographic groups most similar to Immigrants from Caribbean are Kiowa (12.2%, a difference of 0.50%), Immigrants from Central America (12.1%, a difference of 0.68%), Immigrants from Mexico (12.3%, a difference of 0.76%), Ute (12.1%, a difference of 1.1%), and Honduran (12.4%, a difference of 1.5%).
| Demographics | Rating | Rank | Family Poverty |
| Cajuns | 0.0 /100 | #306 | Tragic 11.9% |
| Immigrants | Congo | 0.0 /100 | #307 | Tragic 11.9% |
| Seminole | 0.0 /100 | #308 | Tragic 11.9% |
| Hispanics or Latinos | 0.0 /100 | #309 | Tragic 12.0% |
| Immigrants | Guatemala | 0.0 /100 | #310 | Tragic 12.0% |
| Ute | 0.0 /100 | #311 | Tragic 12.1% |
| Immigrants | Central America | 0.0 /100 | #312 | Tragic 12.1% |
| Immigrants | Caribbean | 0.0 /100 | #313 | Tragic 12.2% |
| Kiowa | 0.0 /100 | #314 | Tragic 12.2% |
| Immigrants | Mexico | 0.0 /100 | #315 | Tragic 12.3% |
| Hondurans | 0.0 /100 | #316 | Tragic 12.4% |
| Immigrants | Grenada | 0.0 /100 | #317 | Tragic 12.4% |
| U.S. Virgin Islanders | 0.0 /100 | #318 | Tragic 12.4% |
| British West Indians | 0.0 /100 | #319 | Tragic 12.4% |
| Inupiat | 0.0 /100 | #320 | Tragic 12.5% |
Demographics Similar to Syrians by Family Poverty
In terms of family poverty, the demographic groups most similar to Syrians are Mongolian (8.6%, a difference of 0.0%), Brazilian (8.6%, a difference of 0.050%), Samoan (8.6%, a difference of 0.13%), Immigrants from Spain (8.6%, a difference of 0.26%), and Scotch-Irish (8.6%, a difference of 0.41%).
| Demographics | Rating | Rank | Family Poverty |
| Immigrants | Germany | 83.3 /100 | #143 | Excellent 8.5% |
| Albanians | 83.3 /100 | #144 | Excellent 8.5% |
| Immigrants | South Eastern Asia | 83.2 /100 | #145 | Excellent 8.5% |
| Immigrants | Belarus | 83.2 /100 | #146 | Excellent 8.5% |
| Immigrants | Jordan | 83.0 /100 | #147 | Excellent 8.5% |
| Scotch-Irish | 82.2 /100 | #148 | Excellent 8.6% |
| Mongolians | 80.4 /100 | #149 | Excellent 8.6% |
| Syrians | 80.3 /100 | #150 | Excellent 8.6% |
| Brazilians | 80.1 /100 | #151 | Excellent 8.6% |
| Samoans | 79.8 /100 | #152 | Good 8.6% |
| Immigrants | Spain | 79.1 /100 | #153 | Good 8.6% |
| Immigrants | Vietnam | 75.4 /100 | #154 | Good 8.7% |
| Immigrants | Kuwait | 73.6 /100 | #155 | Good 8.7% |
| Immigrants | Oceania | 71.2 /100 | #156 | Good 8.7% |
| Tsimshian | 69.3 /100 | #157 | Good 8.8% |