Crow vs Welsh Poverty
COMPARE
Crow
Welsh
Poverty
Poverty Comparison
Crow
Welsh
20.7%
POVERTY
0.0/ 100
METRIC RATING
339th/ 347
METRIC RANK
11.6%
POVERTY
91.6/ 100
METRIC RATING
110th/ 347
METRIC RANK
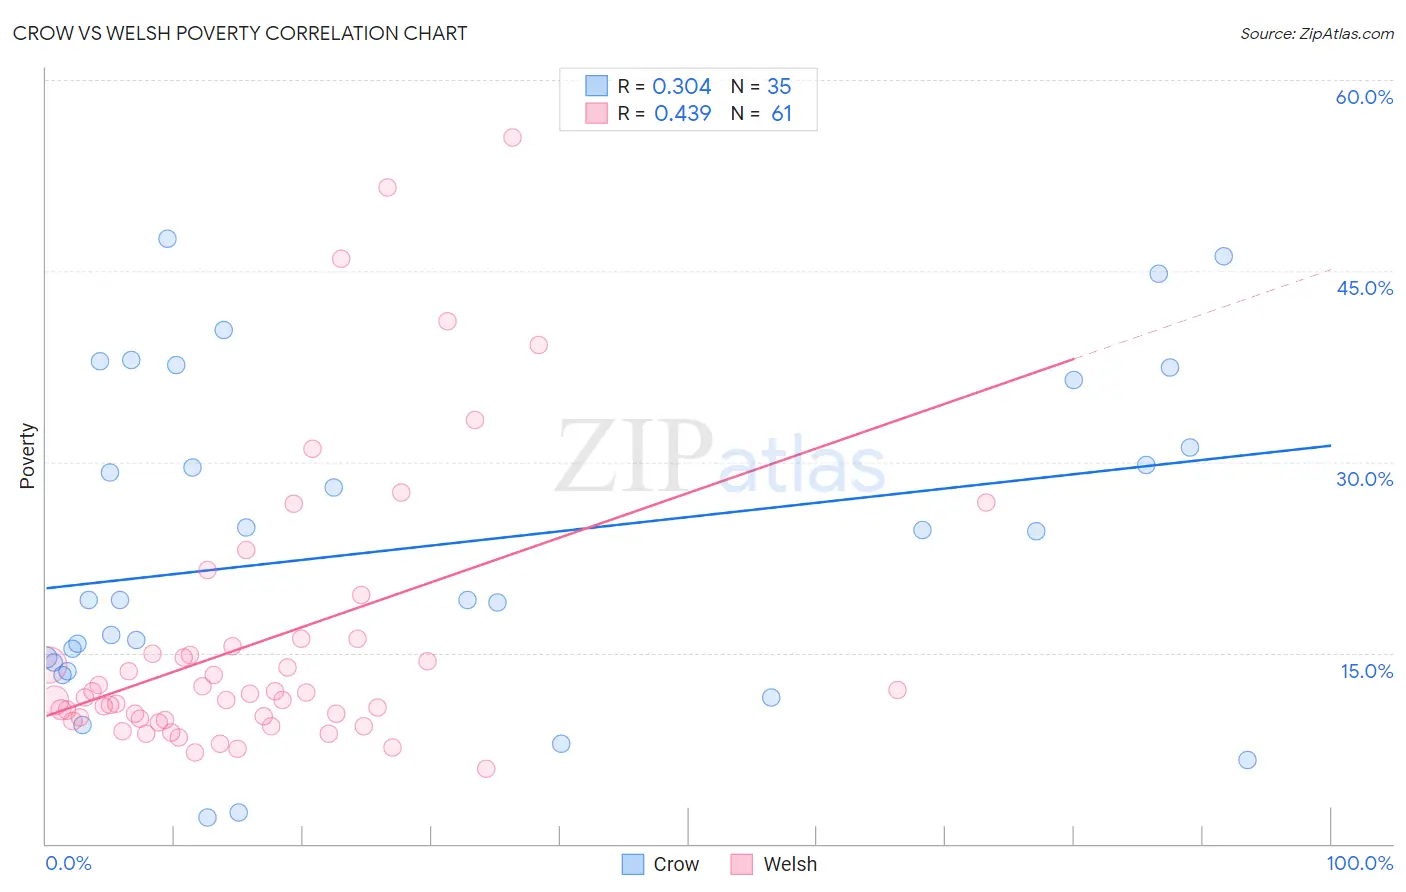
Crow vs Welsh Poverty Correlation Chart
The statistical analysis conducted on geographies consisting of 59,200,262 people shows a mild positive correlation between the proportion of Crow and poverty level in the United States with a correlation coefficient (R) of 0.304 and weighted average of 20.7%. Similarly, the statistical analysis conducted on geographies consisting of 528,094,274 people shows a moderate positive correlation between the proportion of Welsh and poverty level in the United States with a correlation coefficient (R) of 0.439 and weighted average of 11.6%, a difference of 78.0%.
Poverty Correlation Summary
| Measurement | Crow | Welsh |
| Minimum | 2.1% | 5.9% |
| Maximum | 47.5% | 55.5% |
| Range | 45.4% | 49.6% |
| Mean | 23.5% | 16.0% |
| Median | 19.2% | 11.8% |
| Interquartile 25% (IQ1) | 14.3% | 9.8% |
| Interquartile 75% (IQ3) | 36.4% | 15.8% |
| Interquartile Range (IQR) | 22.1% | 6.0% |
| Standard Deviation (Sample) | 12.7% | 11.0% |
| Standard Deviation (Population) | 12.5% | 11.0% |
Similar Demographics by Poverty
Demographics Similar to Crow by Poverty
In terms of poverty, the demographic groups most similar to Crow are Yup'ik (20.8%, a difference of 0.75%), Hopi (20.8%, a difference of 0.93%), Yuman (20.2%, a difference of 2.2%), Immigrants from Yemen (21.5%, a difference of 4.1%), and Sioux (19.8%, a difference of 4.5%).
| Demographics | Rating | Rank | Poverty |
| Natives/Alaskans | 0.0 /100 | #332 | Tragic 18.1% |
| Houma | 0.0 /100 | #333 | Tragic 18.4% |
| Apache | 0.0 /100 | #334 | Tragic 18.4% |
| Cheyenne | 0.0 /100 | #335 | Tragic 18.9% |
| Pueblo | 0.0 /100 | #336 | Tragic 19.4% |
| Sioux | 0.0 /100 | #337 | Tragic 19.8% |
| Yuman | 0.0 /100 | #338 | Tragic 20.2% |
| Crow | 0.0 /100 | #339 | Tragic 20.7% |
| Yup'ik | 0.0 /100 | #340 | Tragic 20.8% |
| Hopi | 0.0 /100 | #341 | Tragic 20.8% |
| Immigrants | Yemen | 0.0 /100 | #342 | Tragic 21.5% |
| Pima | 0.0 /100 | #343 | Tragic 21.9% |
| Lumbee | 0.0 /100 | #344 | Tragic 21.9% |
| Navajo | 0.0 /100 | #345 | Tragic 23.1% |
| Puerto Ricans | 0.0 /100 | #346 | Tragic 23.7% |
Demographics Similar to Welsh by Poverty
In terms of poverty, the demographic groups most similar to Welsh are Immigrants from Turkey (11.6%, a difference of 0.040%), Canadian (11.6%, a difference of 0.060%), Palestinian (11.6%, a difference of 0.090%), French Canadian (11.6%, a difference of 0.17%), and Portuguese (11.6%, a difference of 0.18%).
| Demographics | Rating | Rank | Poverty |
| Okinawans | 92.4 /100 | #103 | Exceptional 11.6% |
| Native Hawaiians | 92.1 /100 | #104 | Exceptional 11.6% |
| Portuguese | 92.1 /100 | #105 | Exceptional 11.6% |
| Immigrants | Zimbabwe | 92.1 /100 | #106 | Exceptional 11.6% |
| Palestinians | 91.8 /100 | #107 | Exceptional 11.6% |
| Canadians | 91.7 /100 | #108 | Exceptional 11.6% |
| Immigrants | Turkey | 91.7 /100 | #109 | Exceptional 11.6% |
| Welsh | 91.6 /100 | #110 | Exceptional 11.6% |
| French Canadians | 91.0 /100 | #111 | Exceptional 11.6% |
| Immigrants | Southern Europe | 90.8 /100 | #112 | Exceptional 11.6% |
| Immigrants | Belarus | 90.8 /100 | #113 | Exceptional 11.6% |
| Immigrants | China | 90.7 /100 | #114 | Exceptional 11.6% |
| Albanians | 90.3 /100 | #115 | Exceptional 11.7% |
| Immigrants | Russia | 89.7 /100 | #116 | Excellent 11.7% |
| Sri Lankans | 89.4 /100 | #117 | Excellent 11.7% |