Jamaican vs Welsh 5th Grade
COMPARE
Jamaican
Welsh
5th Grade
5th Grade Comparison
Jamaicans
Welsh
96.9%
5TH GRADE
0.9/ 100
METRIC RATING
252nd/ 347
METRIC RANK
98.6%
5TH GRADE
100.0/ 100
METRIC RATING
2nd/ 347
METRIC RANK
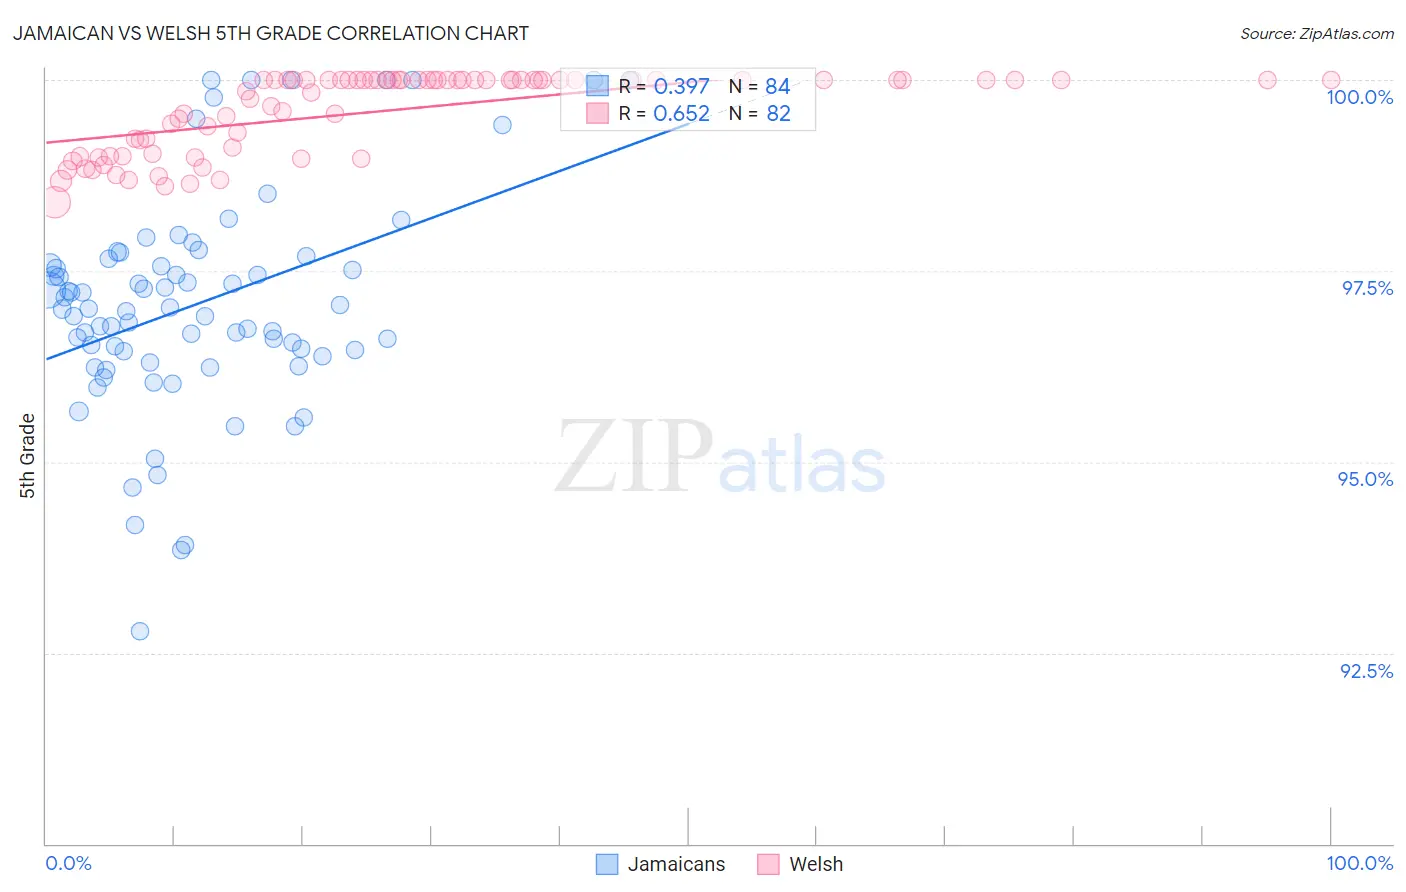
Jamaican vs Welsh 5th Grade Correlation Chart
The statistical analysis conducted on geographies consisting of 368,084,189 people shows a mild positive correlation between the proportion of Jamaicans and percentage of population with at least 5th grade education in the United States with a correlation coefficient (R) of 0.397 and weighted average of 96.9%. Similarly, the statistical analysis conducted on geographies consisting of 239,959,962 people shows a significant positive correlation between the proportion of Welsh and percentage of population with at least 5th grade education in the United States with a correlation coefficient (R) of 0.652 and weighted average of 98.6%, a difference of 1.8%.
5th Grade Correlation Summary
| Measurement | Jamaican | Welsh |
| Minimum | 92.8% | 98.4% |
| Maximum | 100.0% | 100.0% |
| Range | 7.2% | 1.6% |
| Mean | 97.1% | 99.6% |
| Median | 97.0% | 100.0% |
| Interquartile 25% (IQ1) | 96.4% | 99.0% |
| Interquartile 75% (IQ3) | 97.6% | 100.0% |
| Interquartile Range (IQR) | 1.2% | 0.99% |
| Standard Deviation (Sample) | 1.4% | 0.52% |
| Standard Deviation (Population) | 1.4% | 0.51% |
Similar Demographics by 5th Grade
Demographics Similar to Jamaicans by 5th Grade
In terms of 5th grade, the demographic groups most similar to Jamaicans are Bolivian (96.9%, a difference of 0.0%), Immigrants from Uruguay (96.9%, a difference of 0.010%), Immigrants from Liberia (96.9%, a difference of 0.010%), Immigrants from Middle Africa (96.8%, a difference of 0.010%), and Immigrants from Africa (96.9%, a difference of 0.020%).
| Demographics | Rating | Rank | 5th Grade |
| Colombians | 1.3 /100 | #245 | Tragic 96.9% |
| Ethiopians | 1.2 /100 | #246 | Tragic 96.9% |
| Immigrants | Africa | 1.1 /100 | #247 | Tragic 96.9% |
| U.S. Virgin Islanders | 1.1 /100 | #248 | Tragic 96.9% |
| Immigrants | Uruguay | 1.0 /100 | #249 | Tragic 96.9% |
| Immigrants | Liberia | 1.0 /100 | #250 | Tragic 96.9% |
| Bolivians | 0.9 /100 | #251 | Tragic 96.9% |
| Jamaicans | 0.9 /100 | #252 | Tragic 96.9% |
| Immigrants | Middle Africa | 0.8 /100 | #253 | Tragic 96.8% |
| Immigrants | Senegal | 0.8 /100 | #254 | Tragic 96.8% |
| South Americans | 0.7 /100 | #255 | Tragic 96.8% |
| Immigrants | Congo | 0.7 /100 | #256 | Tragic 96.8% |
| Peruvians | 0.6 /100 | #257 | Tragic 96.8% |
| Immigrants | Ethiopia | 0.5 /100 | #258 | Tragic 96.8% |
| Immigrants | China | 0.5 /100 | #259 | Tragic 96.8% |
Demographics Similar to Welsh by 5th Grade
In terms of 5th grade, the demographic groups most similar to Welsh are Norwegian (98.4%, a difference of 0.20%), Tsimshian (98.4%, a difference of 0.20%), Slovak (98.4%, a difference of 0.22%), German (98.4%, a difference of 0.22%), and Inupiat (98.4%, a difference of 0.25%).
| Demographics | Rating | Rank | 5th Grade |
| Crow | 100.0 /100 | #1 | Exceptional 99.5% |
| Welsh | 100.0 /100 | #2 | Exceptional 98.6% |
| Norwegians | 100.0 /100 | #3 | Exceptional 98.4% |
| Tsimshian | 100.0 /100 | #4 | Exceptional 98.4% |
| Slovaks | 100.0 /100 | #5 | Exceptional 98.4% |
| Germans | 100.0 /100 | #6 | Exceptional 98.4% |
| Inupiat | 100.0 /100 | #7 | Exceptional 98.4% |
| Slovenes | 100.0 /100 | #8 | Exceptional 98.3% |
| Swedes | 100.0 /100 | #9 | Exceptional 98.3% |
| English | 100.0 /100 | #10 | Exceptional 98.3% |
| Alaskan Athabascans | 100.0 /100 | #11 | Exceptional 98.3% |
| Carpatho Rusyns | 100.0 /100 | #12 | Exceptional 98.3% |
| Tlingit-Haida | 100.0 /100 | #13 | Exceptional 98.3% |
| Dutch | 100.0 /100 | #14 | Exceptional 98.3% |
| Scottish | 100.0 /100 | #15 | Exceptional 98.3% |