Jamaican vs Immigrants from El Salvador Cognitive Disability
COMPARE
Jamaican
Immigrants from El Salvador
Cognitive Disability
Cognitive Disability Comparison
Jamaicans
Immigrants from El Salvador
17.9%
COGNITIVE DISABILITY
0.9/ 100
METRIC RATING
244th/ 347
METRIC RANK
17.6%
COGNITIVE DISABILITY
7.0/ 100
METRIC RATING
214th/ 347
METRIC RANK
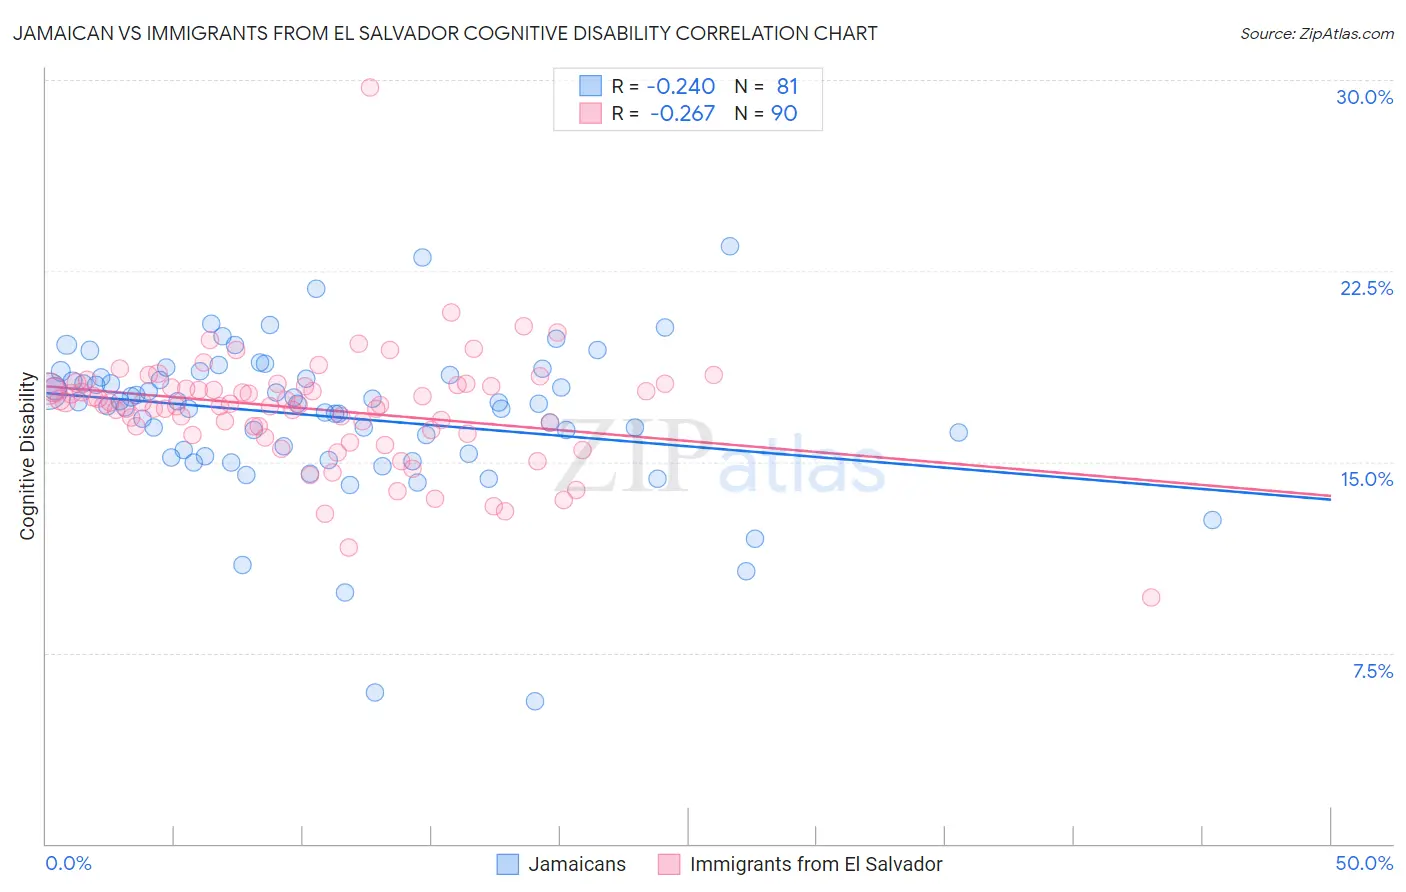
Jamaican vs Immigrants from El Salvador Cognitive Disability Correlation Chart
The statistical analysis conducted on geographies consisting of 367,984,086 people shows a weak negative correlation between the proportion of Jamaicans and percentage of population with cognitive disability in the United States with a correlation coefficient (R) of -0.240 and weighted average of 17.9%. Similarly, the statistical analysis conducted on geographies consisting of 357,776,570 people shows a weak negative correlation between the proportion of Immigrants from El Salvador and percentage of population with cognitive disability in the United States with a correlation coefficient (R) of -0.267 and weighted average of 17.6%, a difference of 1.5%.
Cognitive Disability Correlation Summary
| Measurement | Jamaican | Immigrants from El Salvador |
| Minimum | 5.6% | 9.6% |
| Maximum | 23.5% | 29.7% |
| Range | 17.9% | 20.0% |
| Mean | 16.8% | 17.1% |
| Median | 17.3% | 17.3% |
| Interquartile 25% (IQ1) | 15.3% | 16.2% |
| Interquartile 75% (IQ3) | 18.4% | 18.0% |
| Interquartile Range (IQR) | 3.1% | 1.7% |
| Standard Deviation (Sample) | 3.0% | 2.3% |
| Standard Deviation (Population) | 3.0% | 2.3% |
Similar Demographics by Cognitive Disability
Demographics Similar to Jamaicans by Cognitive Disability
In terms of cognitive disability, the demographic groups most similar to Jamaicans are Immigrants from Bangladesh (17.8%, a difference of 0.040%), Trinidadian and Tobagonian (17.9%, a difference of 0.090%), Paiute (17.8%, a difference of 0.11%), Immigrants from Thailand (17.9%, a difference of 0.12%), and Mexican (17.8%, a difference of 0.13%).
| Demographics | Rating | Rank | Cognitive Disability |
| Immigrants | Mexico | 1.8 /100 | #237 | Tragic 17.8% |
| Cheyenne | 1.7 /100 | #238 | Tragic 17.8% |
| Cajuns | 1.4 /100 | #239 | Tragic 17.8% |
| Iraqis | 1.4 /100 | #240 | Tragic 17.8% |
| Mexicans | 1.1 /100 | #241 | Tragic 17.8% |
| Paiute | 1.1 /100 | #242 | Tragic 17.8% |
| Immigrants | Bangladesh | 1.0 /100 | #243 | Tragic 17.8% |
| Jamaicans | 0.9 /100 | #244 | Tragic 17.9% |
| Trinidadians and Tobagonians | 0.8 /100 | #245 | Tragic 17.9% |
| Immigrants | Thailand | 0.8 /100 | #246 | Tragic 17.9% |
| Samoans | 0.7 /100 | #247 | Tragic 17.9% |
| French American Indians | 0.7 /100 | #248 | Tragic 17.9% |
| Cree | 0.7 /100 | #249 | Tragic 17.9% |
| Immigrants | Ethiopia | 0.7 /100 | #250 | Tragic 17.9% |
| Malaysians | 0.6 /100 | #251 | Tragic 17.9% |
Demographics Similar to Immigrants from El Salvador by Cognitive Disability
In terms of cognitive disability, the demographic groups most similar to Immigrants from El Salvador are Alaskan Athabascan (17.6%, a difference of 0.010%), Hawaiian (17.6%, a difference of 0.020%), Okinawan (17.6%, a difference of 0.020%), Salvadoran (17.6%, a difference of 0.030%), and Immigrants from Oceania (17.6%, a difference of 0.040%).
| Demographics | Rating | Rank | Cognitive Disability |
| Immigrants | Latin America | 9.7 /100 | #207 | Tragic 17.6% |
| Immigrants | Cameroon | 9.3 /100 | #208 | Tragic 17.6% |
| Immigrants | Trinidad and Tobago | 8.7 /100 | #209 | Tragic 17.6% |
| Immigrants | Jamaica | 8.5 /100 | #210 | Tragic 17.6% |
| Taiwanese | 7.7 /100 | #211 | Tragic 17.6% |
| Immigrants | Oceania | 7.3 /100 | #212 | Tragic 17.6% |
| Hawaiians | 7.2 /100 | #213 | Tragic 17.6% |
| Immigrants | El Salvador | 7.0 /100 | #214 | Tragic 17.6% |
| Alaskan Athabascans | 6.9 /100 | #215 | Tragic 17.6% |
| Okinawans | 6.8 /100 | #216 | Tragic 17.6% |
| Salvadorans | 6.7 /100 | #217 | Tragic 17.6% |
| Icelanders | 6.4 /100 | #218 | Tragic 17.6% |
| Immigrants | Sierra Leone | 6.3 /100 | #219 | Tragic 17.6% |
| Zimbabweans | 6.1 /100 | #220 | Tragic 17.6% |
| Moroccans | 5.9 /100 | #221 | Tragic 17.6% |