Jamaican vs Alsatian Single Mother Poverty
COMPARE
Jamaican
Alsatian
Single Mother Poverty
Single Mother Poverty Comparison
Jamaicans
Alsatians
29.9%
SINGLE MOTHER POVERTY
11.7/ 100
METRIC RATING
215th/ 347
METRIC RANK
34.3%
SINGLE MOTHER POVERTY
0.0/ 100
METRIC RATING
311th/ 347
METRIC RANK
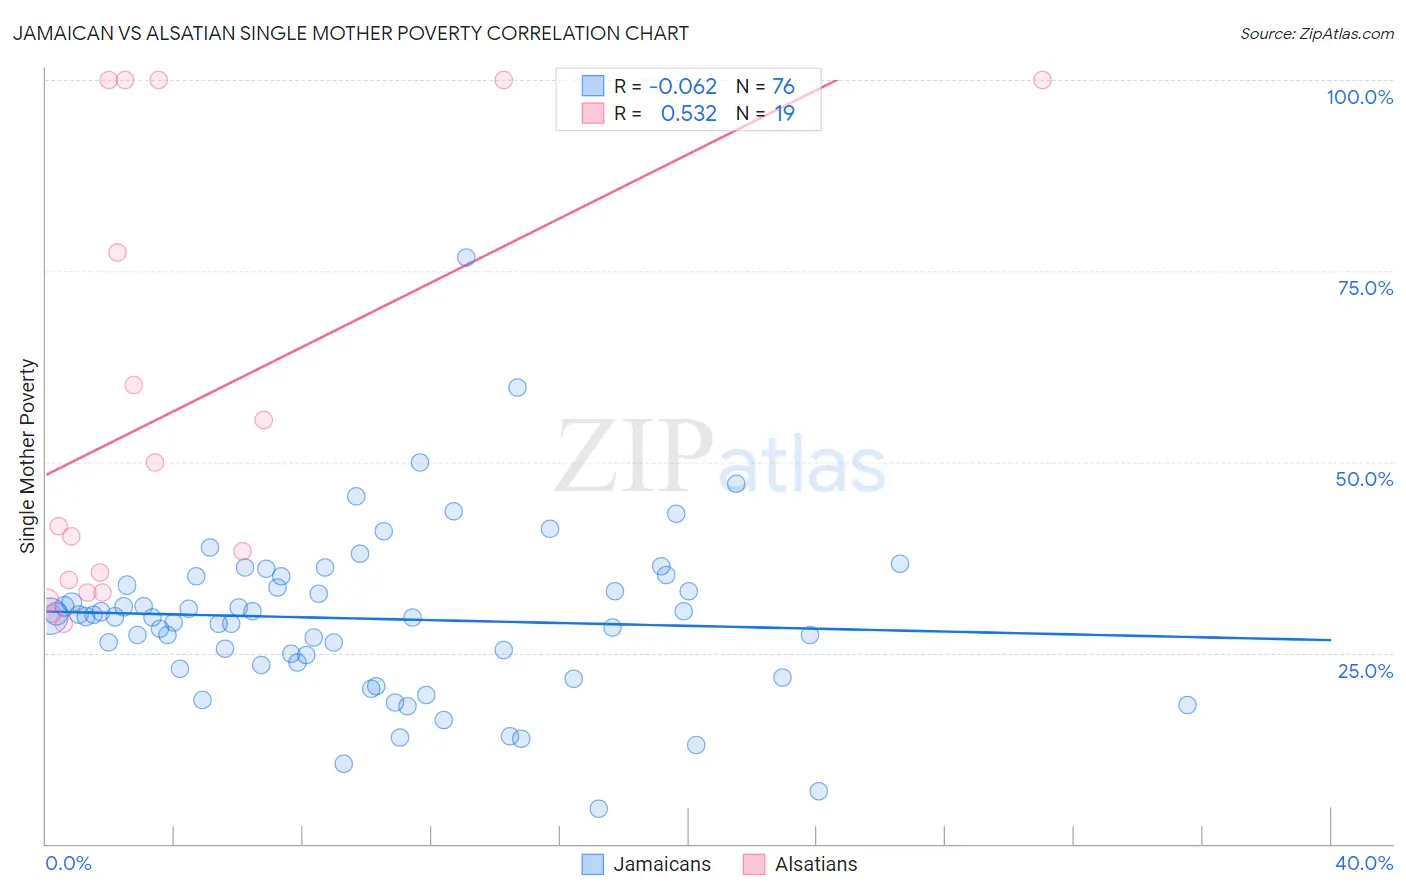
Jamaican vs Alsatian Single Mother Poverty Correlation Chart
The statistical analysis conducted on geographies consisting of 360,593,795 people shows a slight negative correlation between the proportion of Jamaicans and poverty level among single mothers in the United States with a correlation coefficient (R) of -0.062 and weighted average of 29.9%. Similarly, the statistical analysis conducted on geographies consisting of 81,863,686 people shows a substantial positive correlation between the proportion of Alsatians and poverty level among single mothers in the United States with a correlation coefficient (R) of 0.532 and weighted average of 34.3%, a difference of 14.9%.
Single Mother Poverty Correlation Summary
| Measurement | Jamaican | Alsatian |
| Minimum | 4.6% | 28.9% |
| Maximum | 76.7% | 100.0% |
| Range | 72.1% | 71.1% |
| Mean | 29.5% | 57.3% |
| Median | 29.7% | 41.5% |
| Interquartile 25% (IQ1) | 23.5% | 32.9% |
| Interquartile 75% (IQ3) | 34.4% | 100.0% |
| Interquartile Range (IQR) | 10.9% | 67.1% |
| Standard Deviation (Sample) | 11.0% | 28.7% |
| Standard Deviation (Population) | 11.0% | 28.0% |
Similar Demographics by Single Mother Poverty
Demographics Similar to Jamaicans by Single Mother Poverty
In terms of single mother poverty, the demographic groups most similar to Jamaicans are Liberian (29.9%, a difference of 0.0%), Immigrants from Western Africa (29.9%, a difference of 0.020%), Immigrants from Thailand (29.9%, a difference of 0.030%), Immigrants from Ghana (29.9%, a difference of 0.040%), and Nicaraguan (29.8%, a difference of 0.080%).
| Demographics | Rating | Rank | Single Mother Poverty |
| Immigrants | Guyana | 14.7 /100 | #208 | Poor 29.8% |
| Irish | 13.9 /100 | #209 | Poor 29.8% |
| Haitians | 13.3 /100 | #210 | Poor 29.8% |
| Guyanese | 12.8 /100 | #211 | Poor 29.8% |
| Nicaraguans | 12.4 /100 | #212 | Poor 29.8% |
| Immigrants | Thailand | 12.0 /100 | #213 | Poor 29.9% |
| Liberians | 11.7 /100 | #214 | Poor 29.9% |
| Jamaicans | 11.7 /100 | #215 | Poor 29.9% |
| Immigrants | Western Africa | 11.5 /100 | #216 | Poor 29.9% |
| Immigrants | Ghana | 11.3 /100 | #217 | Poor 29.9% |
| Hungarians | 10.3 /100 | #218 | Poor 29.9% |
| Finns | 9.3 /100 | #219 | Tragic 30.0% |
| Germans | 8.8 /100 | #220 | Tragic 30.0% |
| Immigrants | Eritrea | 7.7 /100 | #221 | Tragic 30.0% |
| Sudanese | 7.6 /100 | #222 | Tragic 30.0% |
Demographics Similar to Alsatians by Single Mother Poverty
In terms of single mother poverty, the demographic groups most similar to Alsatians are Central American Indian (34.3%, a difference of 0.080%), Immigrants from Dominican Republic (34.4%, a difference of 0.16%), Honduran (34.2%, a difference of 0.31%), Chickasaw (34.4%, a difference of 0.33%), and Hopi (34.5%, a difference of 0.41%).
| Demographics | Rating | Rank | Single Mother Poverty |
| Mexicans | 0.0 /100 | #304 | Tragic 33.6% |
| Immigrants | Central America | 0.0 /100 | #305 | Tragic 33.6% |
| Immigrants | Congo | 0.0 /100 | #306 | Tragic 33.8% |
| Comanche | 0.0 /100 | #307 | Tragic 33.9% |
| Immigrants | Mexico | 0.0 /100 | #308 | Tragic 34.0% |
| Potawatomi | 0.0 /100 | #309 | Tragic 34.1% |
| Hondurans | 0.0 /100 | #310 | Tragic 34.2% |
| Alsatians | 0.0 /100 | #311 | Tragic 34.3% |
| Central American Indians | 0.0 /100 | #312 | Tragic 34.3% |
| Immigrants | Dominican Republic | 0.0 /100 | #313 | Tragic 34.4% |
| Chickasaw | 0.0 /100 | #314 | Tragic 34.4% |
| Hopi | 0.0 /100 | #315 | Tragic 34.5% |
| Dominicans | 0.0 /100 | #316 | Tragic 34.5% |
| Cherokee | 0.0 /100 | #317 | Tragic 34.5% |
| Immigrants | Honduras | 0.0 /100 | #318 | Tragic 34.7% |