Jamaican vs Colombian Single Mother Poverty
COMPARE
Jamaican
Colombian
Single Mother Poverty
Single Mother Poverty Comparison
Jamaicans
Colombians
29.9%
SINGLE MOTHER POVERTY
11.7/ 100
METRIC RATING
215th/ 347
METRIC RANK
28.3%
SINGLE MOTHER POVERTY
91.8/ 100
METRIC RATING
122nd/ 347
METRIC RANK
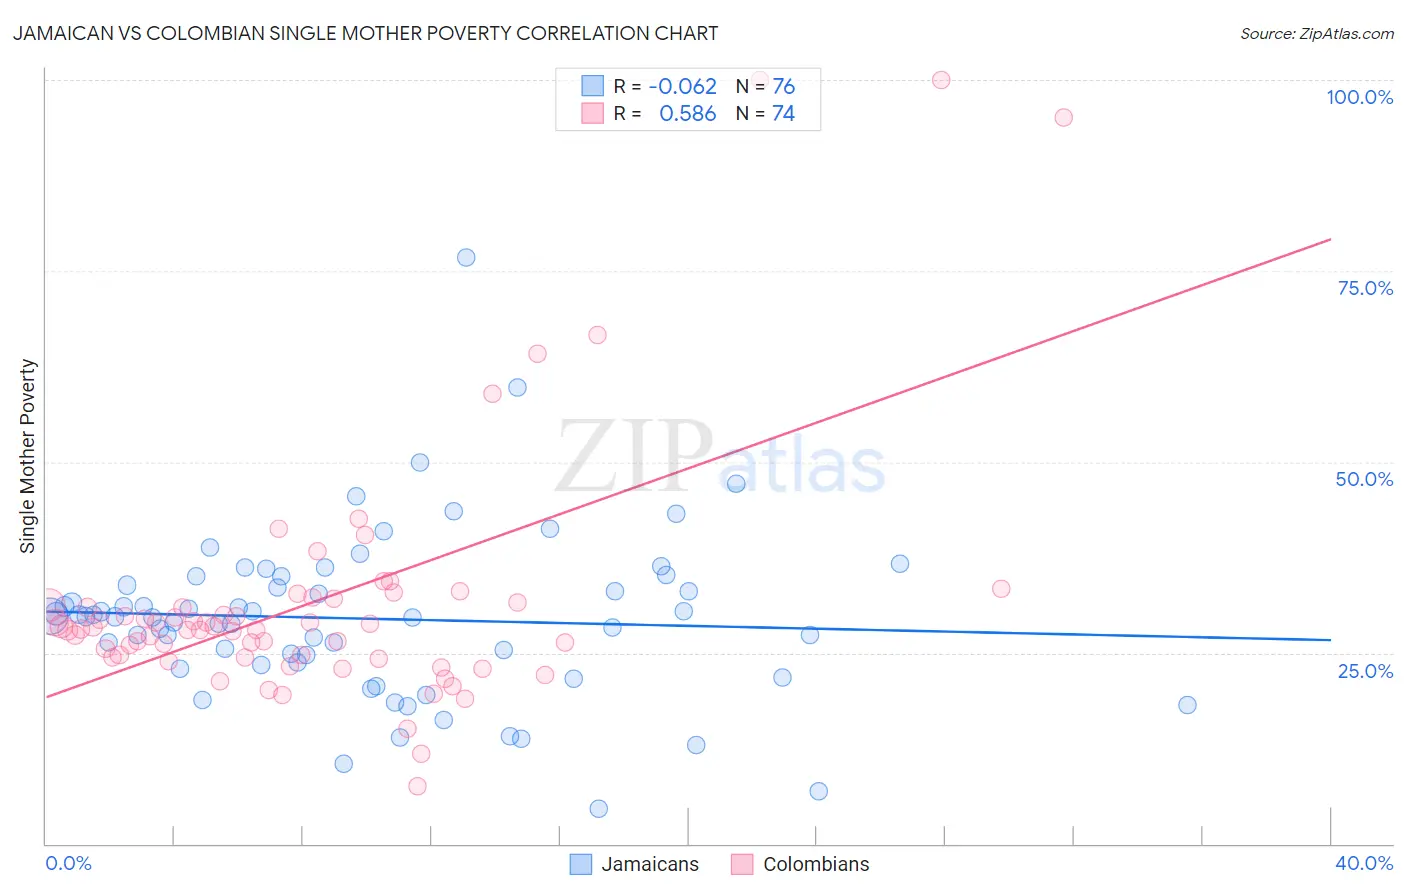
Jamaican vs Colombian Single Mother Poverty Correlation Chart
The statistical analysis conducted on geographies consisting of 360,593,795 people shows a slight negative correlation between the proportion of Jamaicans and poverty level among single mothers in the United States with a correlation coefficient (R) of -0.062 and weighted average of 29.9%. Similarly, the statistical analysis conducted on geographies consisting of 409,096,293 people shows a substantial positive correlation between the proportion of Colombians and poverty level among single mothers in the United States with a correlation coefficient (R) of 0.586 and weighted average of 28.3%, a difference of 5.5%.
Single Mother Poverty Correlation Summary
| Measurement | Jamaican | Colombian |
| Minimum | 4.6% | 7.6% |
| Maximum | 76.7% | 100.0% |
| Range | 72.1% | 92.4% |
| Mean | 29.5% | 31.7% |
| Median | 29.7% | 28.2% |
| Interquartile 25% (IQ1) | 23.5% | 24.4% |
| Interquartile 75% (IQ3) | 34.4% | 31.6% |
| Interquartile Range (IQR) | 10.9% | 7.2% |
| Standard Deviation (Sample) | 11.0% | 16.6% |
| Standard Deviation (Population) | 11.0% | 16.5% |
Similar Demographics by Single Mother Poverty
Demographics Similar to Jamaicans by Single Mother Poverty
In terms of single mother poverty, the demographic groups most similar to Jamaicans are Liberian (29.9%, a difference of 0.0%), Immigrants from Western Africa (29.9%, a difference of 0.020%), Immigrants from Thailand (29.9%, a difference of 0.030%), Immigrants from Ghana (29.9%, a difference of 0.040%), and Nicaraguan (29.8%, a difference of 0.080%).
| Demographics | Rating | Rank | Single Mother Poverty |
| Immigrants | Guyana | 14.7 /100 | #208 | Poor 29.8% |
| Irish | 13.9 /100 | #209 | Poor 29.8% |
| Haitians | 13.3 /100 | #210 | Poor 29.8% |
| Guyanese | 12.8 /100 | #211 | Poor 29.8% |
| Nicaraguans | 12.4 /100 | #212 | Poor 29.8% |
| Immigrants | Thailand | 12.0 /100 | #213 | Poor 29.9% |
| Liberians | 11.7 /100 | #214 | Poor 29.9% |
| Jamaicans | 11.7 /100 | #215 | Poor 29.9% |
| Immigrants | Western Africa | 11.5 /100 | #216 | Poor 29.9% |
| Immigrants | Ghana | 11.3 /100 | #217 | Poor 29.9% |
| Hungarians | 10.3 /100 | #218 | Poor 29.9% |
| Finns | 9.3 /100 | #219 | Tragic 30.0% |
| Germans | 8.8 /100 | #220 | Tragic 30.0% |
| Immigrants | Eritrea | 7.7 /100 | #221 | Tragic 30.0% |
| Sudanese | 7.6 /100 | #222 | Tragic 30.0% |
Demographics Similar to Colombians by Single Mother Poverty
In terms of single mother poverty, the demographic groups most similar to Colombians are Uruguayan (28.3%, a difference of 0.010%), Immigrants from Switzerland (28.3%, a difference of 0.010%), Immigrants from Afghanistan (28.3%, a difference of 0.050%), Cypriot (28.3%, a difference of 0.090%), and Immigrants from Syria (28.3%, a difference of 0.10%).
| Demographics | Rating | Rank | Single Mother Poverty |
| Immigrants | Kuwait | 92.7 /100 | #115 | Exceptional 28.3% |
| Immigrants | Uganda | 92.5 /100 | #116 | Exceptional 28.3% |
| Australians | 92.5 /100 | #117 | Exceptional 28.3% |
| Brazilians | 92.4 /100 | #118 | Exceptional 28.3% |
| Immigrants | Syria | 92.4 /100 | #119 | Exceptional 28.3% |
| Cypriots | 92.3 /100 | #120 | Exceptional 28.3% |
| Immigrants | Afghanistan | 92.1 /100 | #121 | Exceptional 28.3% |
| Colombians | 91.8 /100 | #122 | Exceptional 28.3% |
| Uruguayans | 91.7 /100 | #123 | Exceptional 28.3% |
| Immigrants | Switzerland | 91.7 /100 | #124 | Exceptional 28.3% |
| Kenyans | 90.9 /100 | #125 | Exceptional 28.4% |
| Immigrants | Chile | 90.8 /100 | #126 | Exceptional 28.4% |
| Poles | 90.8 /100 | #127 | Exceptional 28.4% |
| Immigrants | England | 90.5 /100 | #128 | Exceptional 28.4% |
| South Americans | 90.4 /100 | #129 | Exceptional 28.4% |