Jamaican vs Somali Single Mother Poverty
COMPARE
Jamaican
Somali
Single Mother Poverty
Single Mother Poverty Comparison
Jamaicans
Somalis
29.9%
SINGLE MOTHER POVERTY
11.7/ 100
METRIC RATING
215th/ 347
METRIC RANK
32.6%
SINGLE MOTHER POVERTY
0.0/ 100
METRIC RATING
288th/ 347
METRIC RANK
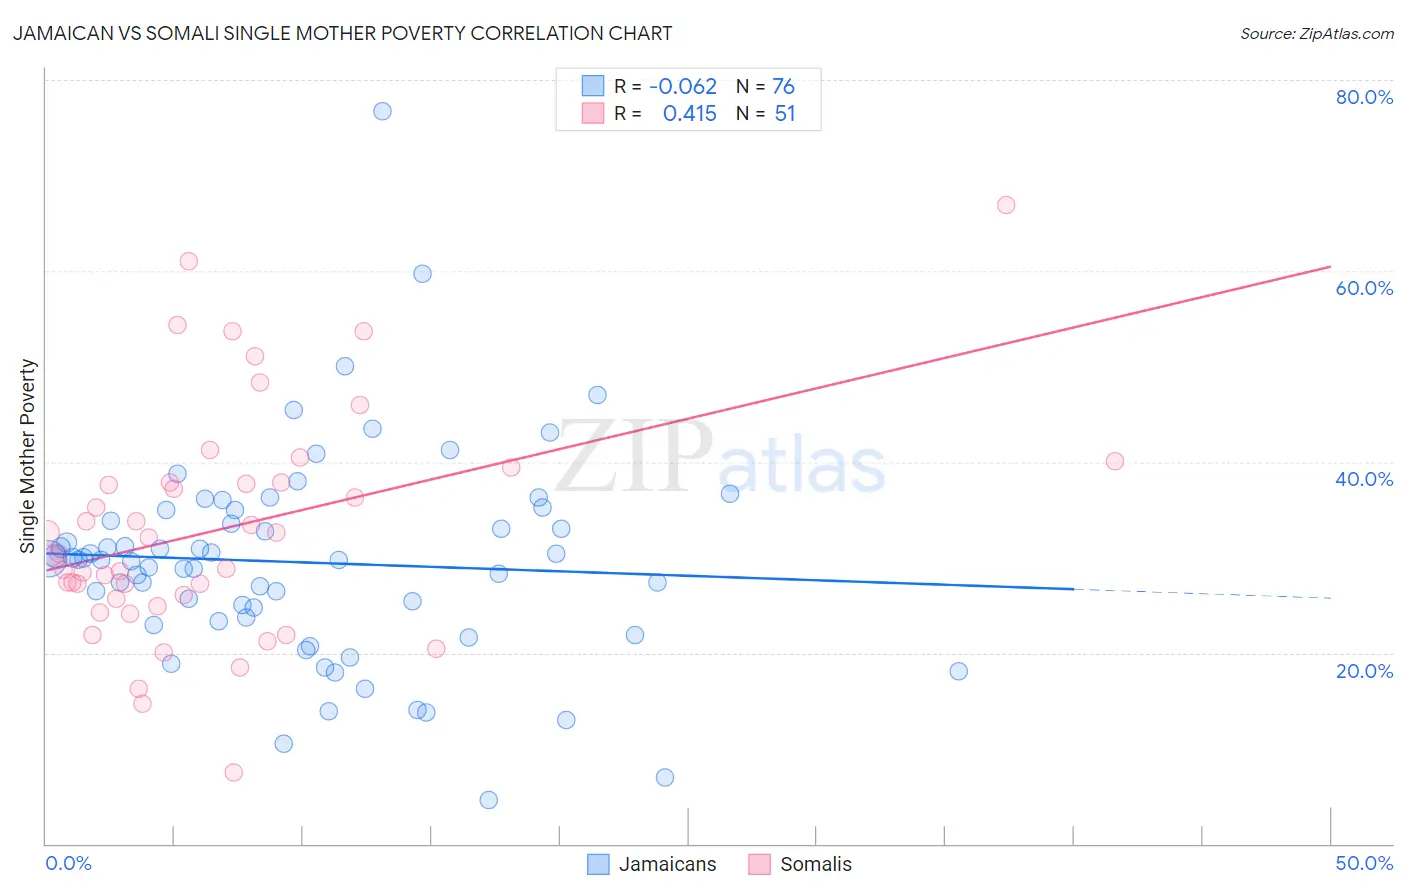
Jamaican vs Somali Single Mother Poverty Correlation Chart
The statistical analysis conducted on geographies consisting of 360,593,795 people shows a slight negative correlation between the proportion of Jamaicans and poverty level among single mothers in the United States with a correlation coefficient (R) of -0.062 and weighted average of 29.9%. Similarly, the statistical analysis conducted on geographies consisting of 98,871,600 people shows a moderate positive correlation between the proportion of Somalis and poverty level among single mothers in the United States with a correlation coefficient (R) of 0.415 and weighted average of 32.6%, a difference of 9.0%.
Single Mother Poverty Correlation Summary
| Measurement | Jamaican | Somali |
| Minimum | 4.6% | 7.5% |
| Maximum | 76.7% | 66.9% |
| Range | 72.1% | 59.4% |
| Mean | 29.5% | 33.0% |
| Median | 29.7% | 30.4% |
| Interquartile 25% (IQ1) | 23.5% | 25.7% |
| Interquartile 75% (IQ3) | 34.4% | 37.9% |
| Interquartile Range (IQR) | 10.9% | 12.2% |
| Standard Deviation (Sample) | 11.0% | 11.9% |
| Standard Deviation (Population) | 11.0% | 11.8% |
Similar Demographics by Single Mother Poverty
Demographics Similar to Jamaicans by Single Mother Poverty
In terms of single mother poverty, the demographic groups most similar to Jamaicans are Liberian (29.9%, a difference of 0.0%), Immigrants from Western Africa (29.9%, a difference of 0.020%), Immigrants from Thailand (29.9%, a difference of 0.030%), Immigrants from Ghana (29.9%, a difference of 0.040%), and Nicaraguan (29.8%, a difference of 0.080%).
| Demographics | Rating | Rank | Single Mother Poverty |
| Immigrants | Guyana | 14.7 /100 | #208 | Poor 29.8% |
| Irish | 13.9 /100 | #209 | Poor 29.8% |
| Haitians | 13.3 /100 | #210 | Poor 29.8% |
| Guyanese | 12.8 /100 | #211 | Poor 29.8% |
| Nicaraguans | 12.4 /100 | #212 | Poor 29.8% |
| Immigrants | Thailand | 12.0 /100 | #213 | Poor 29.9% |
| Liberians | 11.7 /100 | #214 | Poor 29.9% |
| Jamaicans | 11.7 /100 | #215 | Poor 29.9% |
| Immigrants | Western Africa | 11.5 /100 | #216 | Poor 29.9% |
| Immigrants | Ghana | 11.3 /100 | #217 | Poor 29.9% |
| Hungarians | 10.3 /100 | #218 | Poor 29.9% |
| Finns | 9.3 /100 | #219 | Tragic 30.0% |
| Germans | 8.8 /100 | #220 | Tragic 30.0% |
| Immigrants | Eritrea | 7.7 /100 | #221 | Tragic 30.0% |
| Sudanese | 7.6 /100 | #222 | Tragic 30.0% |
Demographics Similar to Somalis by Single Mother Poverty
In terms of single mother poverty, the demographic groups most similar to Somalis are U.S. Virgin Islander (32.6%, a difference of 0.030%), Osage (32.6%, a difference of 0.14%), Immigrants from Dominica (32.5%, a difference of 0.23%), Yup'ik (32.5%, a difference of 0.35%), and Immigrants from Latin America (32.4%, a difference of 0.43%).
| Demographics | Rating | Rank | Single Mother Poverty |
| Cree | 0.0 /100 | #281 | Tragic 32.2% |
| Immigrants | Azores | 0.0 /100 | #282 | Tragic 32.2% |
| Spanish Americans | 0.0 /100 | #283 | Tragic 32.3% |
| Indonesians | 0.0 /100 | #284 | Tragic 32.4% |
| Immigrants | Latin America | 0.0 /100 | #285 | Tragic 32.4% |
| Yup'ik | 0.0 /100 | #286 | Tragic 32.5% |
| Immigrants | Dominica | 0.0 /100 | #287 | Tragic 32.5% |
| Somalis | 0.0 /100 | #288 | Tragic 32.6% |
| U.S. Virgin Islanders | 0.0 /100 | #289 | Tragic 32.6% |
| Osage | 0.0 /100 | #290 | Tragic 32.6% |
| Guatemalans | 0.0 /100 | #291 | Tragic 32.9% |
| Shoshone | 0.0 /100 | #292 | Tragic 32.9% |
| Aleuts | 0.0 /100 | #293 | Tragic 32.9% |
| French American Indians | 0.0 /100 | #294 | Tragic 33.1% |
| Yaqui | 0.0 /100 | #295 | Tragic 33.1% |