Jamaican vs Immigrants from Guyana Single Mother Poverty
COMPARE
Jamaican
Immigrants from Guyana
Single Mother Poverty
Single Mother Poverty Comparison
Jamaicans
Immigrants from Guyana
29.9%
SINGLE MOTHER POVERTY
11.7/ 100
METRIC RATING
215th/ 347
METRIC RANK
29.8%
SINGLE MOTHER POVERTY
14.7/ 100
METRIC RATING
208th/ 347
METRIC RANK
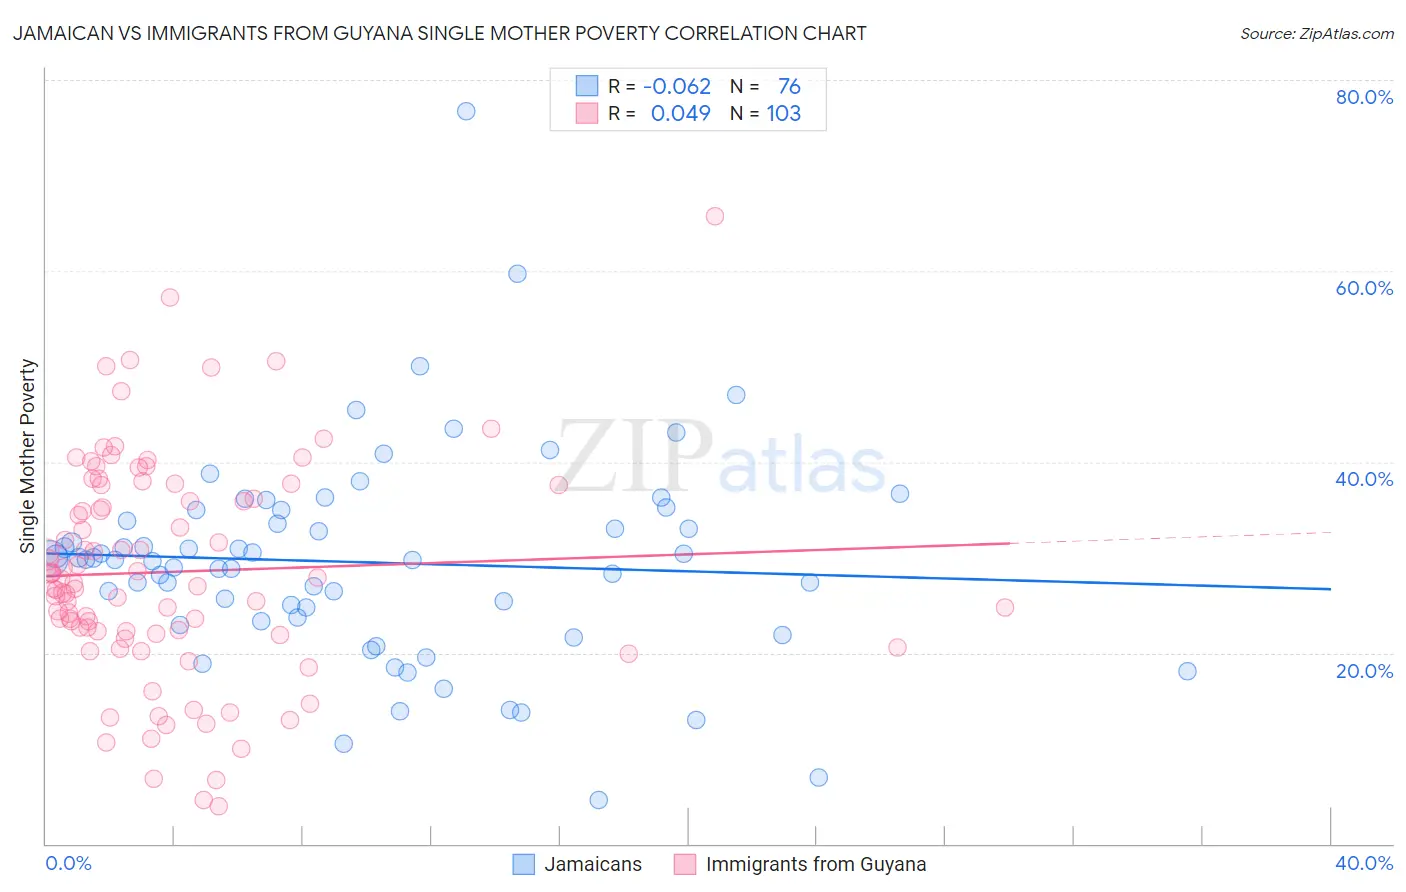
Jamaican vs Immigrants from Guyana Single Mother Poverty Correlation Chart
The statistical analysis conducted on geographies consisting of 360,593,795 people shows a slight negative correlation between the proportion of Jamaicans and poverty level among single mothers in the United States with a correlation coefficient (R) of -0.062 and weighted average of 29.9%. Similarly, the statistical analysis conducted on geographies consisting of 180,945,817 people shows no correlation between the proportion of Immigrants from Guyana and poverty level among single mothers in the United States with a correlation coefficient (R) of 0.049 and weighted average of 29.8%, a difference of 0.31%.
Single Mother Poverty Correlation Summary
| Measurement | Jamaican | Immigrants from Guyana |
| Minimum | 4.6% | 4.0% |
| Maximum | 76.7% | 65.7% |
| Range | 72.1% | 61.7% |
| Mean | 29.5% | 28.5% |
| Median | 29.7% | 27.3% |
| Interquartile 25% (IQ1) | 23.5% | 21.9% |
| Interquartile 75% (IQ3) | 34.4% | 37.6% |
| Interquartile Range (IQR) | 10.9% | 15.6% |
| Standard Deviation (Sample) | 11.0% | 11.5% |
| Standard Deviation (Population) | 11.0% | 11.5% |
Demographics Similar to Jamaicans and Immigrants from Guyana by Single Mother Poverty
In terms of single mother poverty, the demographic groups most similar to Jamaicans are Liberian (29.9%, a difference of 0.0%), Immigrants from Western Africa (29.9%, a difference of 0.020%), Immigrants from Thailand (29.9%, a difference of 0.030%), Immigrants from Ghana (29.9%, a difference of 0.040%), and Nicaraguan (29.8%, a difference of 0.080%). Similarly, the demographic groups most similar to Immigrants from Guyana are Immigrants from Panama (29.8%, a difference of 0.070%), Irish (29.8%, a difference of 0.080%), Immigrants from Haiti (29.7%, a difference of 0.10%), Czechoslovakian (29.7%, a difference of 0.12%), and Haitian (29.8%, a difference of 0.14%).
| Demographics | Rating | Rank | Single Mother Poverty |
| Belgians | 18.8 /100 | #201 | Poor 29.7% |
| Malaysians | 17.4 /100 | #202 | Poor 29.7% |
| Swiss | 17.2 /100 | #203 | Poor 29.7% |
| Immigrants | Immigrants | 16.6 /100 | #204 | Poor 29.7% |
| Czechoslovakians | 16.1 /100 | #205 | Poor 29.7% |
| Immigrants | Haiti | 15.8 /100 | #206 | Poor 29.7% |
| Immigrants | Panama | 15.5 /100 | #207 | Poor 29.8% |
| Immigrants | Guyana | 14.7 /100 | #208 | Poor 29.8% |
| Irish | 13.9 /100 | #209 | Poor 29.8% |
| Haitians | 13.3 /100 | #210 | Poor 29.8% |
| Guyanese | 12.8 /100 | #211 | Poor 29.8% |
| Nicaraguans | 12.4 /100 | #212 | Poor 29.8% |
| Immigrants | Thailand | 12.0 /100 | #213 | Poor 29.9% |
| Liberians | 11.7 /100 | #214 | Poor 29.9% |
| Jamaicans | 11.7 /100 | #215 | Poor 29.9% |
| Immigrants | Western Africa | 11.5 /100 | #216 | Poor 29.9% |
| Immigrants | Ghana | 11.3 /100 | #217 | Poor 29.9% |
| Hungarians | 10.3 /100 | #218 | Poor 29.9% |
| Finns | 9.3 /100 | #219 | Tragic 30.0% |
| Germans | 8.8 /100 | #220 | Tragic 30.0% |
| Immigrants | Eritrea | 7.7 /100 | #221 | Tragic 30.0% |