Jamaican vs Alsatian 7th Grade
COMPARE
Jamaican
Alsatian
7th Grade
7th Grade Comparison
Jamaicans
Alsatians
95.5%
7TH GRADE
2.2/ 100
METRIC RATING
239th/ 347
METRIC RANK
96.1%
7TH GRADE
67.2/ 100
METRIC RATING
159th/ 347
METRIC RANK
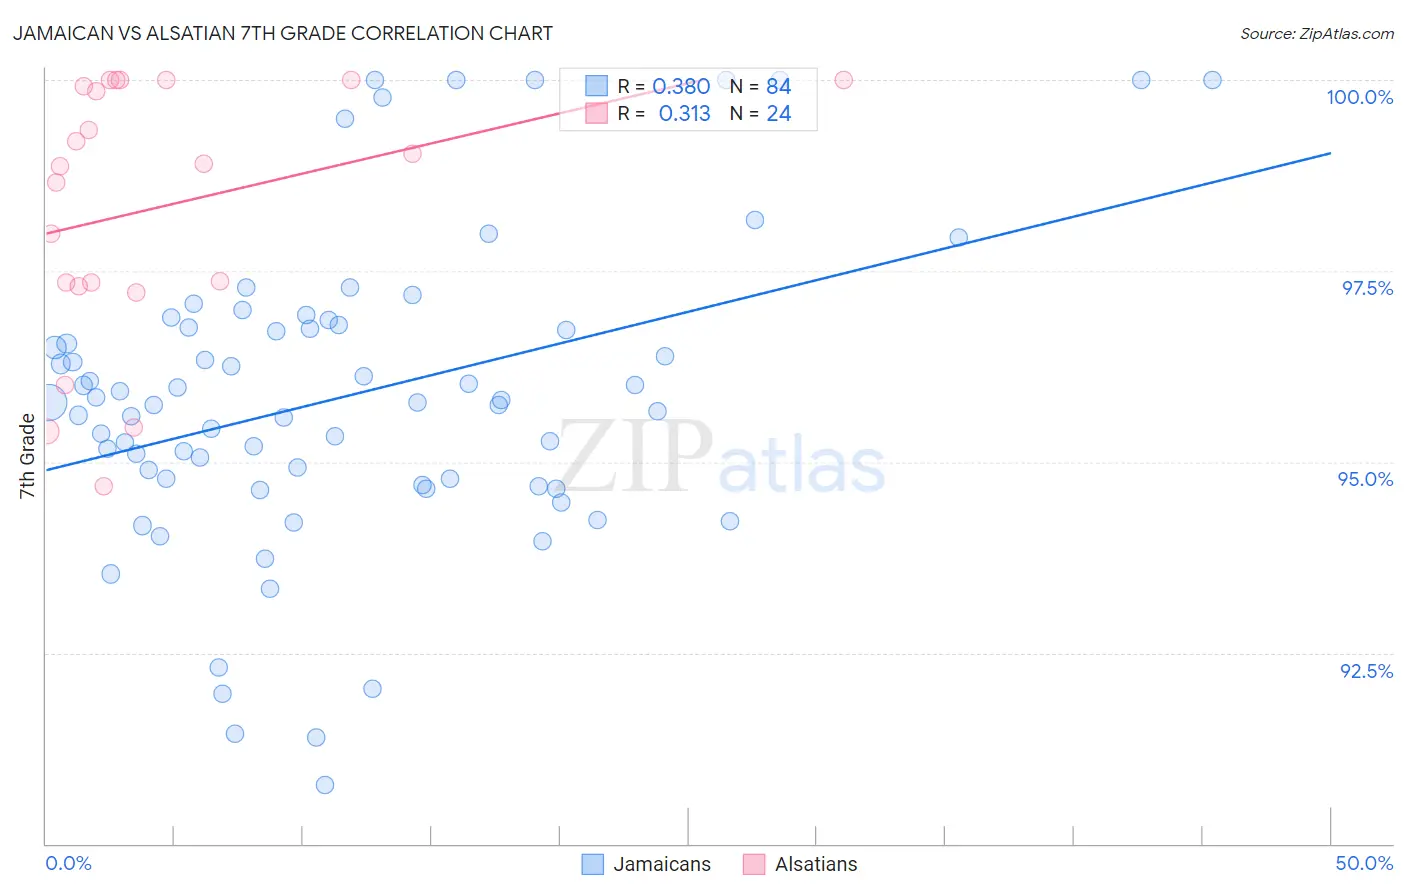
Jamaican vs Alsatian 7th Grade Correlation Chart
The statistical analysis conducted on geographies consisting of 368,084,189 people shows a mild positive correlation between the proportion of Jamaicans and percentage of population with at least 7th grade education in the United States with a correlation coefficient (R) of 0.380 and weighted average of 95.5%. Similarly, the statistical analysis conducted on geographies consisting of 82,676,581 people shows a mild positive correlation between the proportion of Alsatians and percentage of population with at least 7th grade education in the United States with a correlation coefficient (R) of 0.313 and weighted average of 96.1%, a difference of 0.70%.
7th Grade Correlation Summary
| Measurement | Jamaican | Alsatian |
| Minimum | 90.8% | 94.7% |
| Maximum | 100.0% | 100.0% |
| Range | 9.2% | 5.3% |
| Mean | 95.9% | 98.3% |
| Median | 95.8% | 98.9% |
| Interquartile 25% (IQ1) | 94.7% | 97.3% |
| Interquartile 75% (IQ3) | 96.8% | 100.0% |
| Interquartile Range (IQR) | 2.0% | 2.6% |
| Standard Deviation (Sample) | 2.0% | 1.7% |
| Standard Deviation (Population) | 2.0% | 1.7% |
Similar Demographics by 7th Grade
Demographics Similar to Jamaicans by 7th Grade
In terms of 7th grade, the demographic groups most similar to Jamaicans are Immigrants from Asia (95.5%, a difference of 0.010%), Indian (Asian) (95.5%, a difference of 0.010%), Immigrants from Sierra Leone (95.5%, a difference of 0.020%), South American Indian (95.5%, a difference of 0.020%), and Immigrants from Senegal (95.5%, a difference of 0.020%).
| Demographics | Rating | Rank | 7th Grade |
| Costa Ricans | 3.3 /100 | #232 | Tragic 95.5% |
| Immigrants | Indonesia | 3.3 /100 | #233 | Tragic 95.5% |
| Nigerians | 3.0 /100 | #234 | Tragic 95.5% |
| Immigrants | Africa | 2.7 /100 | #235 | Tragic 95.5% |
| Asians | 2.6 /100 | #236 | Tragic 95.5% |
| Immigrants | Asia | 2.3 /100 | #237 | Tragic 95.5% |
| Indians (Asian) | 2.3 /100 | #238 | Tragic 95.5% |
| Jamaicans | 2.2 /100 | #239 | Tragic 95.5% |
| Immigrants | Sierra Leone | 2.0 /100 | #240 | Tragic 95.5% |
| South American Indians | 2.0 /100 | #241 | Tragic 95.5% |
| Immigrants | Senegal | 1.9 /100 | #242 | Tragic 95.5% |
| U.S. Virgin Islanders | 1.6 /100 | #243 | Tragic 95.4% |
| Uruguayans | 1.6 /100 | #244 | Tragic 95.4% |
| Immigrants | Middle Africa | 1.5 /100 | #245 | Tragic 95.4% |
| Ethiopians | 1.5 /100 | #246 | Tragic 95.4% |
Demographics Similar to Alsatians by 7th Grade
In terms of 7th grade, the demographic groups most similar to Alsatians are Immigrants from Kenya (96.1%, a difference of 0.0%), Arab (96.2%, a difference of 0.010%), Bermudan (96.1%, a difference of 0.010%), Pima (96.1%, a difference of 0.020%), and Spaniard (96.1%, a difference of 0.030%).
| Demographics | Rating | Rank | 7th Grade |
| Immigrants | Russia | 78.4 /100 | #152 | Good 96.2% |
| Seminole | 78.1 /100 | #153 | Good 96.2% |
| Immigrants | Israel | 77.6 /100 | #154 | Good 96.2% |
| Immigrants | Jordan | 77.0 /100 | #155 | Good 96.2% |
| Kenyans | 76.2 /100 | #156 | Good 96.2% |
| Ugandans | 75.5 /100 | #157 | Good 96.2% |
| Arabs | 68.6 /100 | #158 | Good 96.2% |
| Alsatians | 67.2 /100 | #159 | Good 96.1% |
| Immigrants | Kenya | 66.8 /100 | #160 | Good 96.1% |
| Bermudans | 66.3 /100 | #161 | Good 96.1% |
| Pima | 64.3 /100 | #162 | Good 96.1% |
| Spaniards | 62.6 /100 | #163 | Good 96.1% |
| Immigrants | Italy | 62.1 /100 | #164 | Good 96.1% |
| Immigrants | Taiwan | 61.5 /100 | #165 | Good 96.1% |
| Immigrants | Kazakhstan | 61.0 /100 | #166 | Good 96.1% |