Jamaican vs Cheyenne Single Mother Poverty
COMPARE
Jamaican
Cheyenne
Single Mother Poverty
Single Mother Poverty Comparison
Jamaicans
Cheyenne
29.9%
SINGLE MOTHER POVERTY
11.7/ 100
METRIC RATING
215th/ 347
METRIC RANK
38.5%
SINGLE MOTHER POVERTY
0.0/ 100
METRIC RATING
336th/ 347
METRIC RANK
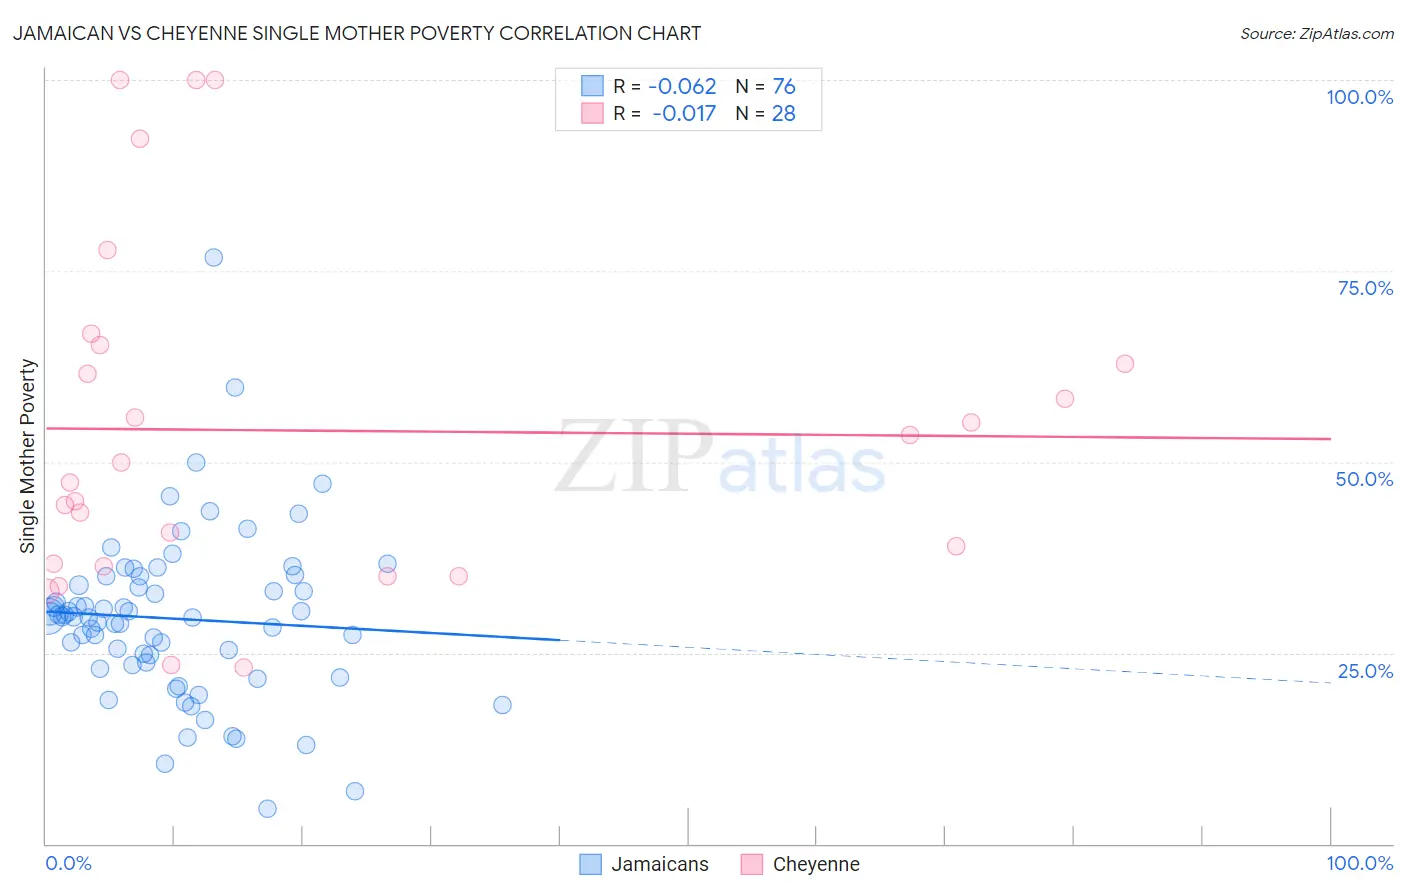
Jamaican vs Cheyenne Single Mother Poverty Correlation Chart
The statistical analysis conducted on geographies consisting of 360,593,795 people shows a slight negative correlation between the proportion of Jamaicans and poverty level among single mothers in the United States with a correlation coefficient (R) of -0.062 and weighted average of 29.9%. Similarly, the statistical analysis conducted on geographies consisting of 80,348,704 people shows no correlation between the proportion of Cheyenne and poverty level among single mothers in the United States with a correlation coefficient (R) of -0.017 and weighted average of 38.5%, a difference of 28.9%.
Single Mother Poverty Correlation Summary
| Measurement | Jamaican | Cheyenne |
| Minimum | 4.6% | 23.1% |
| Maximum | 76.7% | 100.0% |
| Range | 72.1% | 76.9% |
| Mean | 29.5% | 54.1% |
| Median | 29.7% | 48.6% |
| Interquartile 25% (IQ1) | 23.5% | 36.5% |
| Interquartile 75% (IQ3) | 34.4% | 64.1% |
| Interquartile Range (IQR) | 10.9% | 27.6% |
| Standard Deviation (Sample) | 11.0% | 22.5% |
| Standard Deviation (Population) | 11.0% | 22.1% |
Similar Demographics by Single Mother Poverty
Demographics Similar to Jamaicans by Single Mother Poverty
In terms of single mother poverty, the demographic groups most similar to Jamaicans are Liberian (29.9%, a difference of 0.0%), Immigrants from Western Africa (29.9%, a difference of 0.020%), Immigrants from Thailand (29.9%, a difference of 0.030%), Immigrants from Ghana (29.9%, a difference of 0.040%), and Nicaraguan (29.8%, a difference of 0.080%).
| Demographics | Rating | Rank | Single Mother Poverty |
| Immigrants | Guyana | 14.7 /100 | #208 | Poor 29.8% |
| Irish | 13.9 /100 | #209 | Poor 29.8% |
| Haitians | 13.3 /100 | #210 | Poor 29.8% |
| Guyanese | 12.8 /100 | #211 | Poor 29.8% |
| Nicaraguans | 12.4 /100 | #212 | Poor 29.8% |
| Immigrants | Thailand | 12.0 /100 | #213 | Poor 29.9% |
| Liberians | 11.7 /100 | #214 | Poor 29.9% |
| Jamaicans | 11.7 /100 | #215 | Poor 29.9% |
| Immigrants | Western Africa | 11.5 /100 | #216 | Poor 29.9% |
| Immigrants | Ghana | 11.3 /100 | #217 | Poor 29.9% |
| Hungarians | 10.3 /100 | #218 | Poor 29.9% |
| Finns | 9.3 /100 | #219 | Tragic 30.0% |
| Germans | 8.8 /100 | #220 | Tragic 30.0% |
| Immigrants | Eritrea | 7.7 /100 | #221 | Tragic 30.0% |
| Sudanese | 7.6 /100 | #222 | Tragic 30.0% |
Demographics Similar to Cheyenne by Single Mother Poverty
In terms of single mother poverty, the demographic groups most similar to Cheyenne are Immigrants from Yemen (38.5%, a difference of 0.040%), Pima (38.6%, a difference of 0.25%), Crow (38.6%, a difference of 0.34%), Sioux (38.8%, a difference of 0.74%), and Yuman (37.8%, a difference of 1.9%).
| Demographics | Rating | Rank | Single Mother Poverty |
| Apache | 0.0 /100 | #329 | Tragic 36.6% |
| Natives/Alaskans | 0.0 /100 | #330 | Tragic 36.6% |
| Creek | 0.0 /100 | #331 | Tragic 36.7% |
| Dutch West Indians | 0.0 /100 | #332 | Tragic 36.8% |
| Menominee | 0.0 /100 | #333 | Tragic 37.1% |
| Pueblo | 0.0 /100 | #334 | Tragic 37.2% |
| Yuman | 0.0 /100 | #335 | Tragic 37.8% |
| Cheyenne | 0.0 /100 | #336 | Tragic 38.5% |
| Immigrants | Yemen | 0.0 /100 | #337 | Tragic 38.5% |
| Pima | 0.0 /100 | #338 | Tragic 38.6% |
| Crow | 0.0 /100 | #339 | Tragic 38.6% |
| Sioux | 0.0 /100 | #340 | Tragic 38.8% |
| Colville | 0.0 /100 | #341 | Tragic 39.3% |
| Navajo | 0.0 /100 | #342 | Tragic 40.2% |
| Cajuns | 0.0 /100 | #343 | Tragic 40.3% |