Jamaican vs Bulgarian Single Mother Poverty
COMPARE
Jamaican
Bulgarian
Single Mother Poverty
Single Mother Poverty Comparison
Jamaicans
Bulgarians
29.9%
SINGLE MOTHER POVERTY
11.7/ 100
METRIC RATING
215th/ 347
METRIC RANK
26.5%
SINGLE MOTHER POVERTY
99.9/ 100
METRIC RATING
33rd/ 347
METRIC RANK
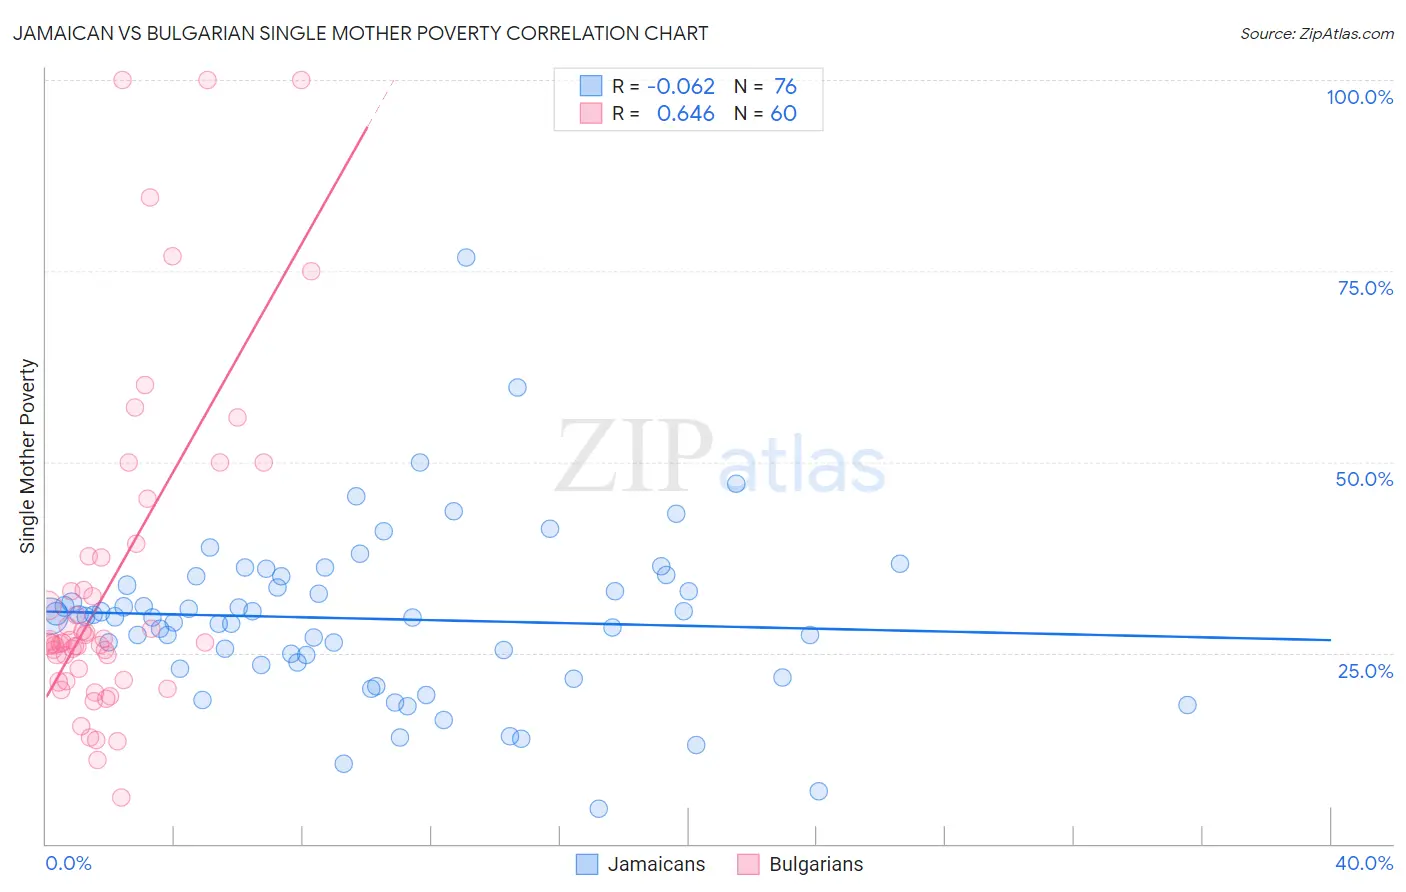
Jamaican vs Bulgarian Single Mother Poverty Correlation Chart
The statistical analysis conducted on geographies consisting of 360,593,795 people shows a slight negative correlation between the proportion of Jamaicans and poverty level among single mothers in the United States with a correlation coefficient (R) of -0.062 and weighted average of 29.9%. Similarly, the statistical analysis conducted on geographies consisting of 202,203,367 people shows a significant positive correlation between the proportion of Bulgarians and poverty level among single mothers in the United States with a correlation coefficient (R) of 0.646 and weighted average of 26.5%, a difference of 12.5%.
Single Mother Poverty Correlation Summary
| Measurement | Jamaican | Bulgarian |
| Minimum | 4.6% | 6.1% |
| Maximum | 76.7% | 100.0% |
| Range | 72.1% | 93.9% |
| Mean | 29.5% | 34.4% |
| Median | 29.7% | 26.4% |
| Interquartile 25% (IQ1) | 23.5% | 22.1% |
| Interquartile 75% (IQ3) | 34.4% | 37.5% |
| Interquartile Range (IQR) | 10.9% | 15.4% |
| Standard Deviation (Sample) | 11.0% | 21.8% |
| Standard Deviation (Population) | 11.0% | 21.6% |
Similar Demographics by Single Mother Poverty
Demographics Similar to Jamaicans by Single Mother Poverty
In terms of single mother poverty, the demographic groups most similar to Jamaicans are Liberian (29.9%, a difference of 0.0%), Immigrants from Western Africa (29.9%, a difference of 0.020%), Immigrants from Thailand (29.9%, a difference of 0.030%), Immigrants from Ghana (29.9%, a difference of 0.040%), and Nicaraguan (29.8%, a difference of 0.080%).
| Demographics | Rating | Rank | Single Mother Poverty |
| Immigrants | Guyana | 14.7 /100 | #208 | Poor 29.8% |
| Irish | 13.9 /100 | #209 | Poor 29.8% |
| Haitians | 13.3 /100 | #210 | Poor 29.8% |
| Guyanese | 12.8 /100 | #211 | Poor 29.8% |
| Nicaraguans | 12.4 /100 | #212 | Poor 29.8% |
| Immigrants | Thailand | 12.0 /100 | #213 | Poor 29.9% |
| Liberians | 11.7 /100 | #214 | Poor 29.9% |
| Jamaicans | 11.7 /100 | #215 | Poor 29.9% |
| Immigrants | Western Africa | 11.5 /100 | #216 | Poor 29.9% |
| Immigrants | Ghana | 11.3 /100 | #217 | Poor 29.9% |
| Hungarians | 10.3 /100 | #218 | Poor 29.9% |
| Finns | 9.3 /100 | #219 | Tragic 30.0% |
| Germans | 8.8 /100 | #220 | Tragic 30.0% |
| Immigrants | Eritrea | 7.7 /100 | #221 | Tragic 30.0% |
| Sudanese | 7.6 /100 | #222 | Tragic 30.0% |
Demographics Similar to Bulgarians by Single Mother Poverty
In terms of single mother poverty, the demographic groups most similar to Bulgarians are Immigrants from Indonesia (26.6%, a difference of 0.010%), Tongan (26.5%, a difference of 0.040%), Maltese (26.6%, a difference of 0.13%), Okinawan (26.6%, a difference of 0.18%), and Immigrants from Israel (26.6%, a difference of 0.18%).
| Demographics | Rating | Rank | Single Mother Poverty |
| Immigrants | Sri Lanka | 100.0 /100 | #26 | Exceptional 26.3% |
| Immigrants | Japan | 100.0 /100 | #27 | Exceptional 26.4% |
| Koreans | 100.0 /100 | #28 | Exceptional 26.4% |
| Jordanians | 100.0 /100 | #29 | Exceptional 26.4% |
| Turks | 100.0 /100 | #30 | Exceptional 26.4% |
| Immigrants | Philippines | 100.0 /100 | #31 | Exceptional 26.5% |
| Tongans | 99.9 /100 | #32 | Exceptional 26.5% |
| Bulgarians | 99.9 /100 | #33 | Exceptional 26.5% |
| Immigrants | Indonesia | 99.9 /100 | #34 | Exceptional 26.6% |
| Maltese | 99.9 /100 | #35 | Exceptional 26.6% |
| Okinawans | 99.9 /100 | #36 | Exceptional 26.6% |
| Immigrants | Israel | 99.9 /100 | #37 | Exceptional 26.6% |
| Immigrants | Fiji | 99.9 /100 | #38 | Exceptional 26.6% |
| Sri Lankans | 99.9 /100 | #39 | Exceptional 26.7% |
| Immigrants | Vietnam | 99.9 /100 | #40 | Exceptional 26.7% |