Israeli vs Alsatian Single Mother Poverty
COMPARE
Israeli
Alsatian
Single Mother Poverty
Single Mother Poverty Comparison
Israelis
Alsatians
28.0%
SINGLE MOTHER POVERTY
96.5/ 100
METRIC RATING
105th/ 347
METRIC RANK
34.3%
SINGLE MOTHER POVERTY
0.0/ 100
METRIC RATING
311th/ 347
METRIC RANK
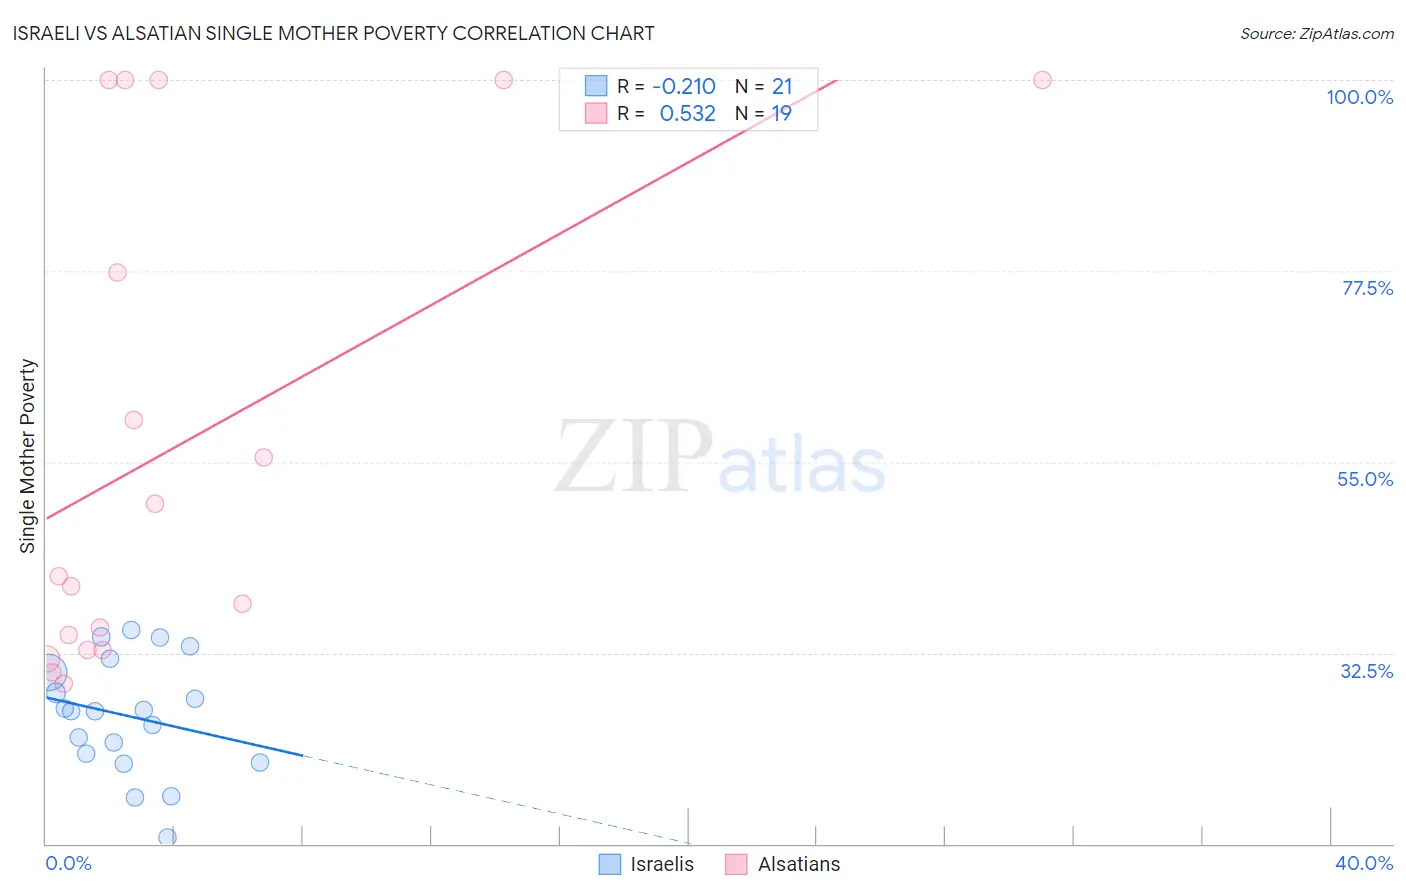
Israeli vs Alsatian Single Mother Poverty Correlation Chart
The statistical analysis conducted on geographies consisting of 207,028,427 people shows a weak negative correlation between the proportion of Israelis and poverty level among single mothers in the United States with a correlation coefficient (R) of -0.210 and weighted average of 28.0%. Similarly, the statistical analysis conducted on geographies consisting of 81,863,686 people shows a substantial positive correlation between the proportion of Alsatians and poverty level among single mothers in the United States with a correlation coefficient (R) of 0.532 and weighted average of 34.3%, a difference of 22.5%.
Single Mother Poverty Correlation Summary
| Measurement | Israeli | Alsatian |
| Minimum | 10.8% | 28.9% |
| Maximum | 35.2% | 100.0% |
| Range | 24.4% | 71.1% |
| Mean | 25.1% | 57.3% |
| Median | 25.6% | 41.5% |
| Interquartile 25% (IQ1) | 20.1% | 32.9% |
| Interquartile 75% (IQ3) | 31.0% | 100.0% |
| Interquartile Range (IQR) | 10.9% | 67.1% |
| Standard Deviation (Sample) | 6.8% | 28.7% |
| Standard Deviation (Population) | 6.6% | 28.0% |
Similar Demographics by Single Mother Poverty
Demographics Similar to Israelis by Single Mother Poverty
In terms of single mother poverty, the demographic groups most similar to Israelis are Italian (28.0%, a difference of 0.020%), Immigrants from Northern Africa (28.0%, a difference of 0.040%), Ukrainian (28.0%, a difference of 0.040%), Immigrants from Croatia (28.0%, a difference of 0.060%), and Pakistani (28.0%, a difference of 0.16%).
| Demographics | Rating | Rank | Single Mother Poverty |
| Immigrants | Nepal | 97.2 /100 | #98 | Exceptional 27.9% |
| Immigrants | Netherlands | 97.2 /100 | #99 | Exceptional 27.9% |
| Zimbabweans | 97.1 /100 | #100 | Exceptional 27.9% |
| Pakistanis | 96.9 /100 | #101 | Exceptional 28.0% |
| Immigrants | Croatia | 96.7 /100 | #102 | Exceptional 28.0% |
| Immigrants | Northern Africa | 96.6 /100 | #103 | Exceptional 28.0% |
| Italians | 96.6 /100 | #104 | Exceptional 28.0% |
| Israelis | 96.5 /100 | #105 | Exceptional 28.0% |
| Ukrainians | 96.4 /100 | #106 | Exceptional 28.0% |
| Immigrants | Venezuela | 95.8 /100 | #107 | Exceptional 28.1% |
| Immigrants | Zimbabwe | 95.5 /100 | #108 | Exceptional 28.1% |
| Immigrants | Armenia | 95.2 /100 | #109 | Exceptional 28.1% |
| Croatians | 94.8 /100 | #110 | Exceptional 28.2% |
| Venezuelans | 94.5 /100 | #111 | Exceptional 28.2% |
| Immigrants | Kazakhstan | 94.5 /100 | #112 | Exceptional 28.2% |
Demographics Similar to Alsatians by Single Mother Poverty
In terms of single mother poverty, the demographic groups most similar to Alsatians are Central American Indian (34.3%, a difference of 0.080%), Immigrants from Dominican Republic (34.4%, a difference of 0.16%), Honduran (34.2%, a difference of 0.31%), Chickasaw (34.4%, a difference of 0.33%), and Hopi (34.5%, a difference of 0.41%).
| Demographics | Rating | Rank | Single Mother Poverty |
| Mexicans | 0.0 /100 | #304 | Tragic 33.6% |
| Immigrants | Central America | 0.0 /100 | #305 | Tragic 33.6% |
| Immigrants | Congo | 0.0 /100 | #306 | Tragic 33.8% |
| Comanche | 0.0 /100 | #307 | Tragic 33.9% |
| Immigrants | Mexico | 0.0 /100 | #308 | Tragic 34.0% |
| Potawatomi | 0.0 /100 | #309 | Tragic 34.1% |
| Hondurans | 0.0 /100 | #310 | Tragic 34.2% |
| Alsatians | 0.0 /100 | #311 | Tragic 34.3% |
| Central American Indians | 0.0 /100 | #312 | Tragic 34.3% |
| Immigrants | Dominican Republic | 0.0 /100 | #313 | Tragic 34.4% |
| Chickasaw | 0.0 /100 | #314 | Tragic 34.4% |
| Hopi | 0.0 /100 | #315 | Tragic 34.5% |
| Dominicans | 0.0 /100 | #316 | Tragic 34.5% |
| Cherokee | 0.0 /100 | #317 | Tragic 34.5% |
| Immigrants | Honduras | 0.0 /100 | #318 | Tragic 34.7% |